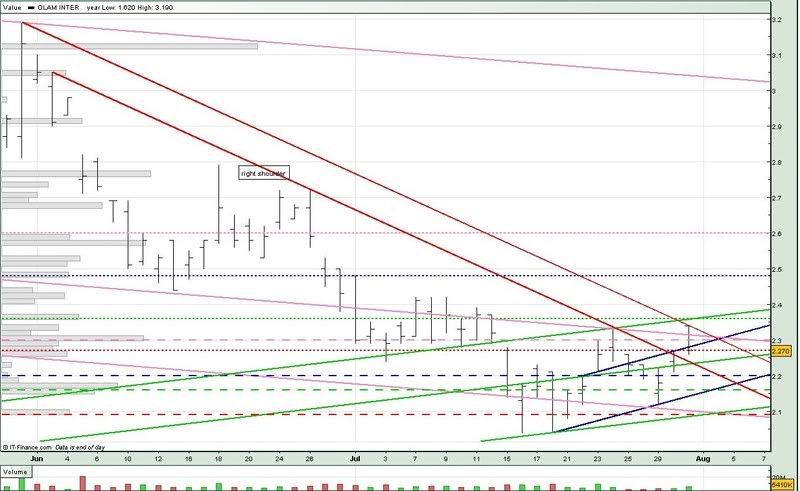
However, during the rest of the day, we saw Olam softening gradually and it closed below the uptrend resistance (upp blue) and long term downtrend resistance (mid pink) and right on the 2.27 support (red ...).
Although Olam has broken out of the downtrend resistance (upp red), it is still too early to say if Olam has bottomed out. From the chart, you can also see that Olam has created quite a resistance for itself at around the 2.30 level (pink --) where 3 trendlines converge, and also as showen by the volume distribution bar.
If Olam cannot hold onto its 2.27 support, we could see it revisiting the 2.20 support (blue --).
If the 2.27 support holds, we could see Olam trading sideways for the time being.

For tomorrow :
Support @ 2.27 (red ...), 2.238 (mid green), 2.22 (low red), 2.20 (blue --), 2.16 (green --)
Resistance @ 2.29 (upp blue), 2.30 (pink --), 2.31 (mid pink), 2.32 (upp red), 2.36 (upp green, green ...)


No comments:
Post a Comment