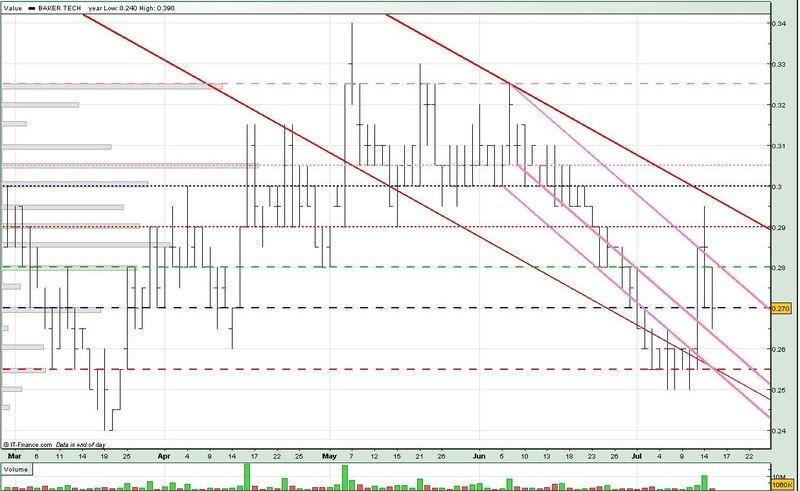
With 10m done on 14 jul, you can expect many people to be 'trapped' above the 0.280 level (green --). Looking at the chart, Baker Tech seems to have difficulty breaking out of the downtrend channel (pink).
We could see Baker Tech trading sideways, at best, along the 0.270 level (blue --). And if it doesn't break the 0.280 level (green --) soon, or if BakerTech slips below the 0.270 level, we could see it test the downtrend support (mid pink).

For tomorrow :
Support @ 0.270 (blue --), 0.262 (mid pink), 0.255 (low red, red --), 0.253 (low pink)
Resistance @ 0.280 (upp pink, green --), 0.290 (red ...), 0.295 (upp red)
Hope you find my analysis helpful. Thank you for your support !!


No comments:
Post a Comment