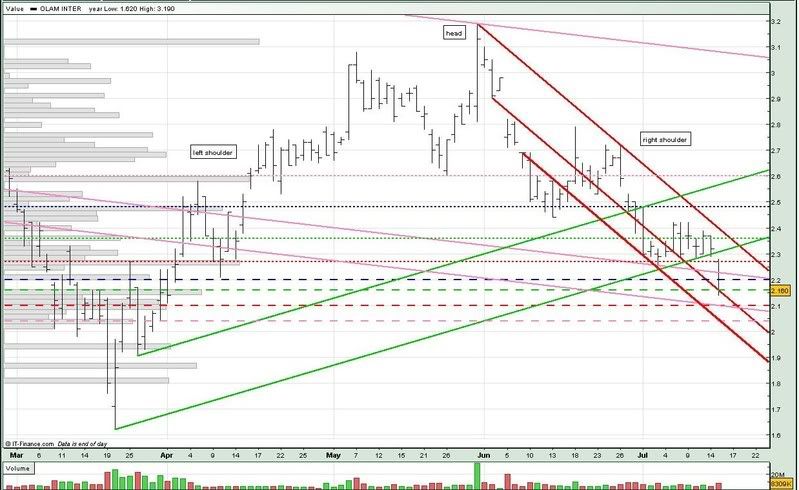
Olam closed right on the downtrend support (mid red) and 2.16 support (green --). Today's breakdown was also accompanied by an increased in volume, which usually doesn't bode well.
Olam could have formed a Head & Shoulders (a broader one) which I've indicated on the chart. Neckline looks to be at the 2.60 level. Since the peak is 3.19 (30 may), which gives us a difference of almost 60 cents. So we could be looking at Olam hitting a low of around 2.00 (2.60 - 0.60) before there could be any chance of a reversal.
Going back to the trendlines, what this means is that we could see Olam weakening further, and testing the 2.04 support (pink --) sooner rather than later. The last time we saw Olam hitting such low prices was in mar.

For tomorrow :
Support @ 2.16 (green --), 2.13 (mid red), 2.10 (low pink, red --), 2.04 (pink --), 2.02 (low red)
Resistance @ 2.20 (blue --), 2.22 (mid pink), 2.27 (red ...), 2.31 (low green), 2.36 (green ...)
Hope you find my analysis helpful. Thank you for your support !!


No comments:
Post a Comment