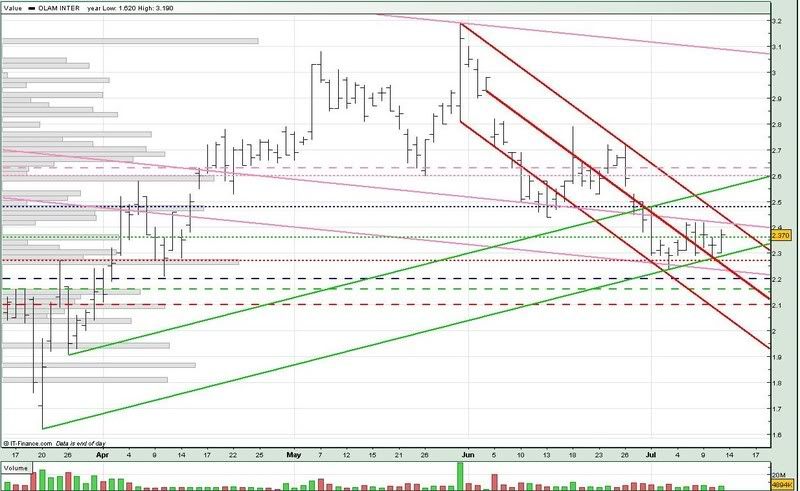
As you can see from the chart, Olam is still trading withing the long term downtrend channel (pink). The sideways trading could be a consolidation phase for Olam. It would have to trade above the 2.36 neckline (green ...) before we can have any chance of a reversal.
However, if Olam breaks the uptrend support (low green) and the 2.27 support (red ...), we could see Olam testing the long term downtrend support (low pink), or even the 2.10 support (red --).

For monday :
Support @ 2.36 (green ...), 2.295 (low green), 2.27 (red ...), 2.236 (mid red), 2.23 (low pink), 2.20 (blue --)
Resistance @ 2.41 (mid pink), 2.43 (upp red), 2.48 (blue ...), 2.553 (upp green)
Hope you find my analysis helpful. Thank you for your support !!


No comments:
Post a Comment