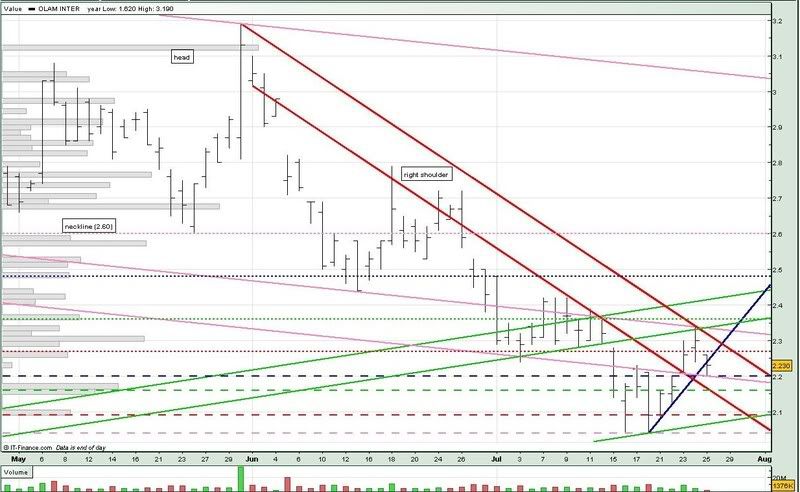
Olam also broke the short term uptrend support (blue) and tested the long term downtrend support (low pink) today. As you can see from the chart, Olam is still quite a long way from it peak of 3.19 on 30 may.
If the 2.20 support (blue --) holds, we could see Olam trading sideways between the 2.20 support and 2.27 resistance (red ...).

For monday :
Support @ 2.20 (low pink, blue --), 2.16 (green --), 2.14 (low red), 2.09 (red --), 2.07 (low green)
Resistance @ 2.27 (red ...), 2.28 (blue), 2.30 (mid red), 2.33 (mid pink), 2.34 (mid green), 2.36 (green ...)


No comments:
Post a Comment