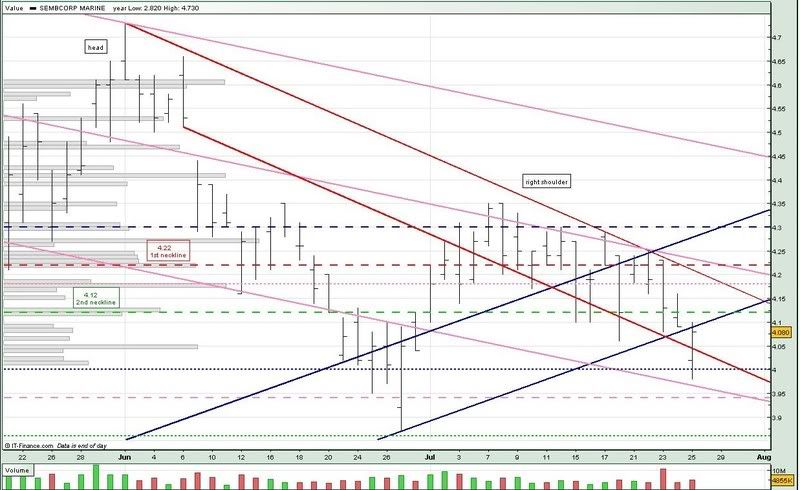
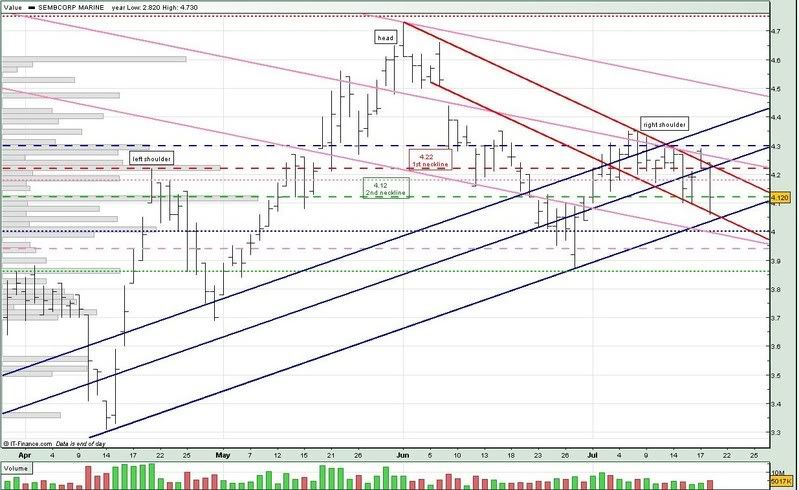
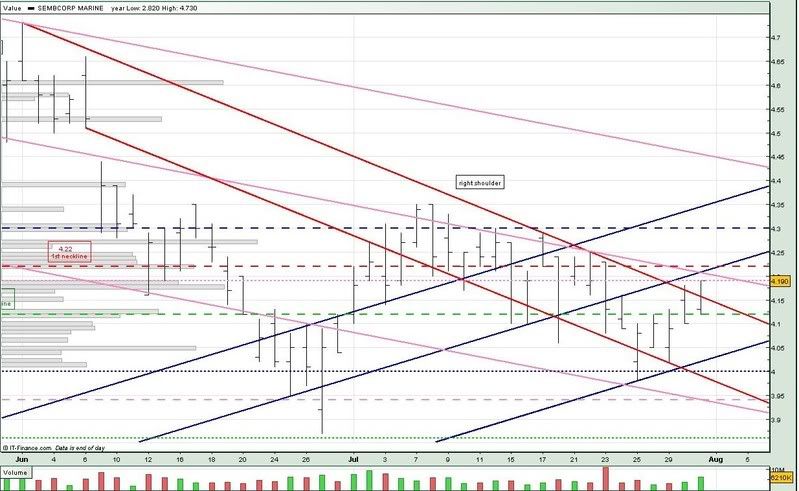
As discussed on 25 jul, Sembcorp Marine closed rather strongly on that day, and we also saw it testing the 4.12 neckline (green --) twice.
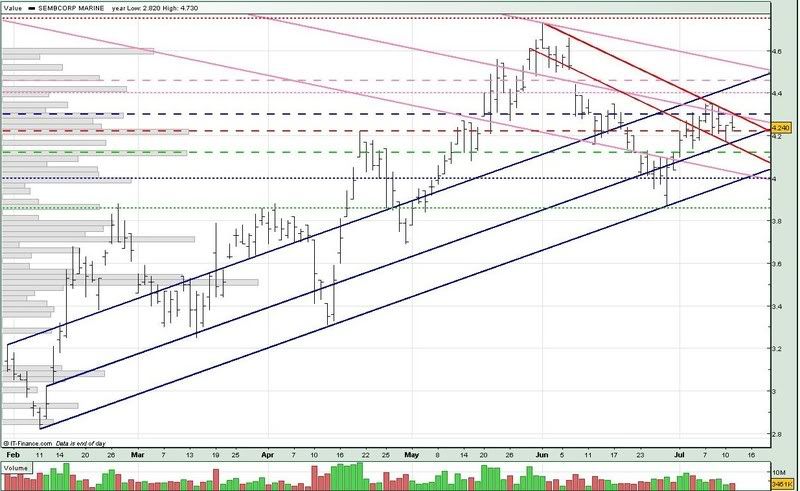
Sembcorp Marine finally broke the 4.12 neckline (green --), as well as the downtrend resistance (upp red), today. It also closed right on the 4.19 resistance (pink ...).
Will Sembcorp Marine break the crucial 4.22 neckline (red --) ? It would have to first have to break the 4.19 resistance (pink ...) as well as the long term downtrend resistance (mid pink). Of course, that's provided Sembcorp Marine doesn't succumb to profit taking and break the 4.12 neckline (green --).
For tomorrow :
Support @ 4.14 (upp red), 4.12 (green --), 4.03 (low blue), 4.00 (blue ...)
Resistance @ 4.19 (pink ...), 4.20 (mid pink), 4.22 (mid blue, red --), 4.30 (blue --)
Thursday, July 31, 2008
Olam 310708
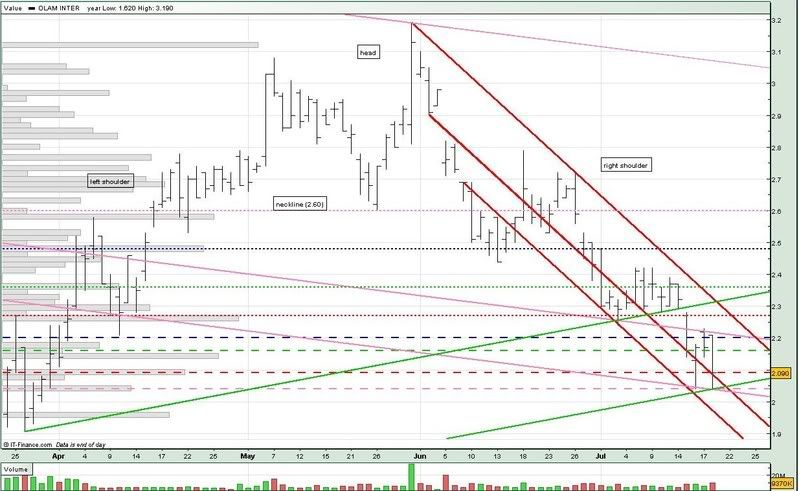
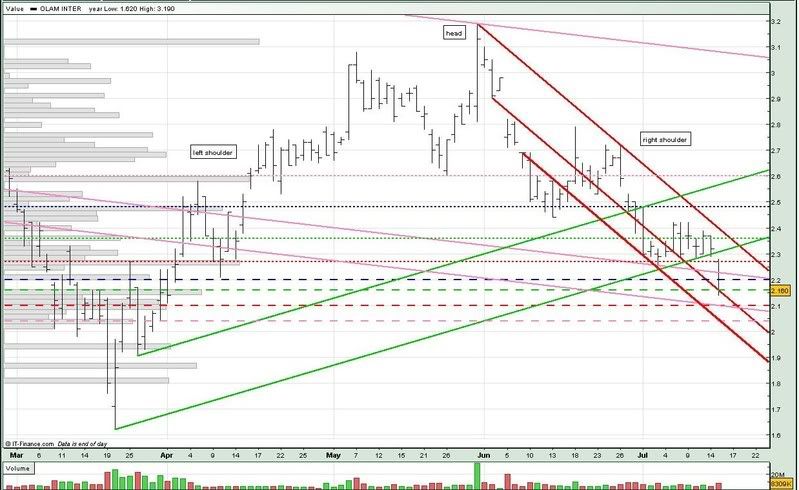
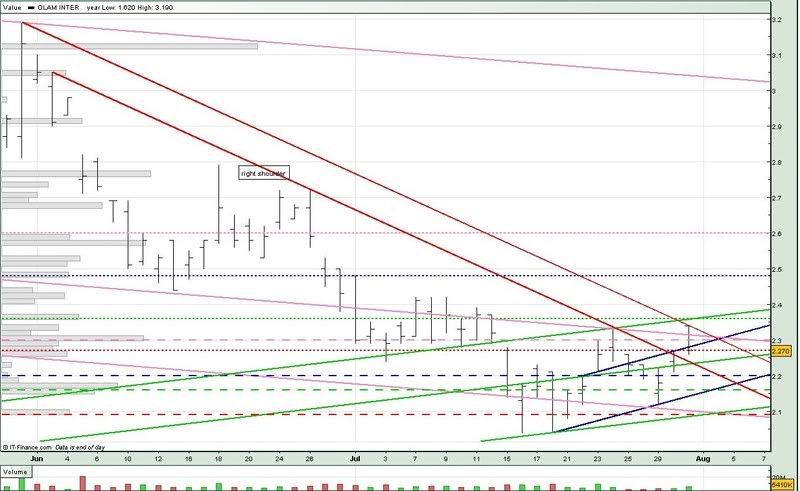
Olam started the day quite brightly when it opened above the long term downtrend resistance (mid pink) with almost half of the day's volume done.
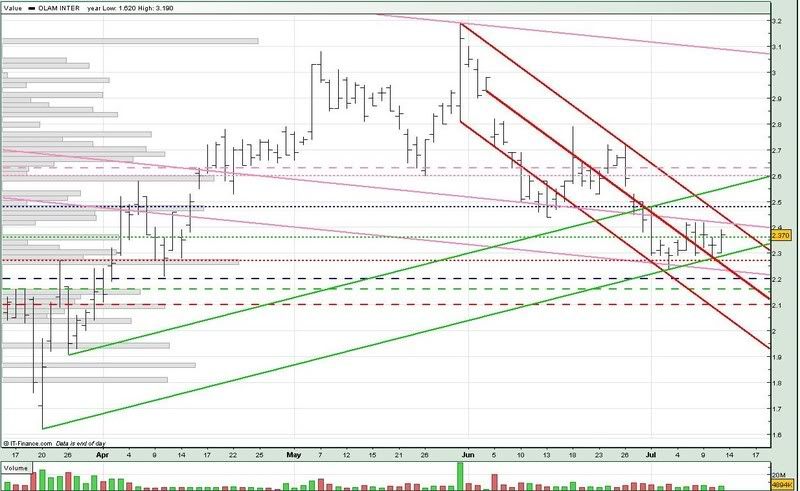
However, during the rest of the day, we saw Olam softening gradually and it closed below the uptrend resistance (upp blue) and long term downtrend resistance (mid pink) and right on the 2.27 support (red ...).
Although Olam has broken out of the downtrend resistance (upp red), it is still too early to say if Olam has bottomed out. From the chart, you can also see that Olam has created quite a resistance for itself at around the 2.30 level (pink --) where 3 trendlines converge, and also as showen by the volume distribution bar.
If Olam cannot hold onto its 2.27 support, we could see it revisiting the 2.20 support (blue --).
If the 2.27 support holds, we could see Olam trading sideways for the time being.
For tomorrow :
Support @ 2.27 (red ...), 2.238 (mid green), 2.22 (low red), 2.20 (blue --), 2.16 (green --)
Resistance @ 2.29 (upp blue), 2.30 (pink --), 2.31 (mid pink), 2.32 (upp red), 2.36 (upp green, green ...)
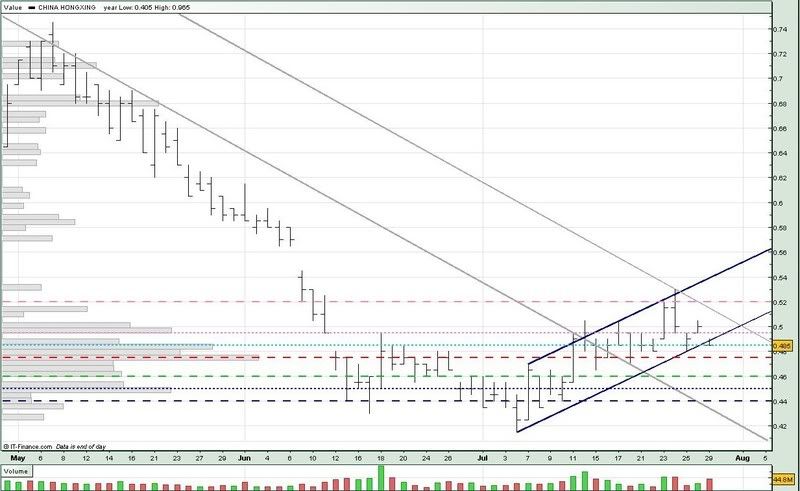
China HongX 310708
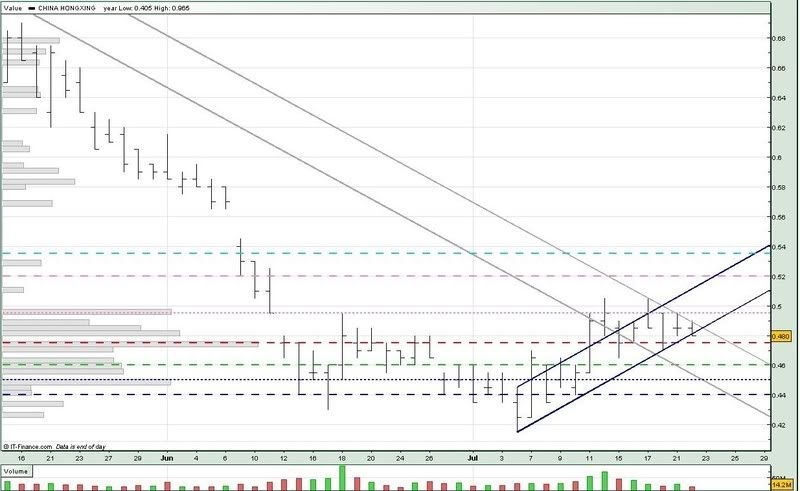
Today was T + 5 (from 23 jul) and we saw China Hongxing breaking the 0.485 support (light blue ...). As you can also see from the chart, China Hongxing's peaks have been lower since its high on 24 jul.
We could still see China Hongxing trading sideways between the 0.485 support (light blue ...) and 0.495 resistance (pink ...), provided it doesn't break the 0.475 support (red --). Considering that tomorrow is a Friday, and it's another T + 5 day for those who bought on 24 jul, testing or even breaking the 0.475 support (red --) isn't impossible.
For tomorrow :
Support @ 0.475 (red --), 0.465 (mid grey), 0.460 (green --), 0.450 (blue ...), 0.440 (blue --)
Resistance @ 0.4835 (blue), 0.485 (light blue ...), 0.495 (pink ...), 0.500 (upp grey)
Wednesday, July 30, 2008
SPC Q2 revenue leaps 65%, but profit up marginally
Higher costs, weak US$ offset better refining margin; no divestment gain
By NISHA RAMCHANDANI
DESPITE revenue surging almost 65 per cent to $3.25 billion for the second quarter, Singapore Petroleum Company (SPC) recorded a marginal 0.6 per cent year-on-year rise in net profit to $180.26 million for the three months ended 30 June.
Earnings per share rose to 34.96 cents for the quarter from 34.79 cents for the year-ago comparative period.
For the first six months of this year, net profit fell to $278.75 million from $291.34 million in 1H07 while revenue grew 52.8 per cent from $3.9 billion to $5.96 billion.
An interim one-tier (tax exempt) dividend of 20 cents per share will be paid out on Aug 26.
In Q2, SPC completed its scheduled maintenance programme of the Catalytic Reformer (CRU) and the Hydrocracker 2 (HCU2) upgrading units which led to total crude and feedstock throughput being reduced by 9 per cent to 263,000 barrels per day. However, sales volume increased to 19.3 million barrels from 18.3 million in the corresponding quarter for 2007.
For the quarter, the group achieved an average refining margin of US$13 per barrel, compared with US$9 per barrel for 2Q07. This was offset by lower refinery product throughput, higher processing costs, higher hedging costs and the weaker US dollar, said SPC.
Another key factor is that there was no divestment income in Q2 2008, against $14.1 million in Q2 2007.
Downstream activities contributed $3.15 billion in Q2 turnover and a pre-tax profit of $164.2 million, while exploration and production (E&P) contributed $94.3 million in turnover and a pre-tax profit of $61.1 million.
While the group achieved a higher pre-tax profit of $225.3 million in Q2 2008, higher E&P taxes totalling $23 million increased the group's overall income tax expense to $45.1 million, 75.6 per cent higher than in Q2 2007.
For H1 2008, 'demand for refined products remained robust despite the increases in oil prices,' said SPC.
On prospects ahead, demand might be hit by the slowing global economy in the next 12 months and the reduction of government subsidies in several Asian countries, SPC said. 'The new Reliance Jamnagar refinery coming onstream would add to supply and affect refining margins,' it said.
'However sustainable demand from China, India, Russia and the Middle East will lend support to refining margins. We expact margins to remain healthy.'
The company expects to stay profitable for the rest of the year. SPC shares closed trading yesterday at $6.53, down 2 cents.
You can read SPC's news release here.
Tuesday, July 29, 2008
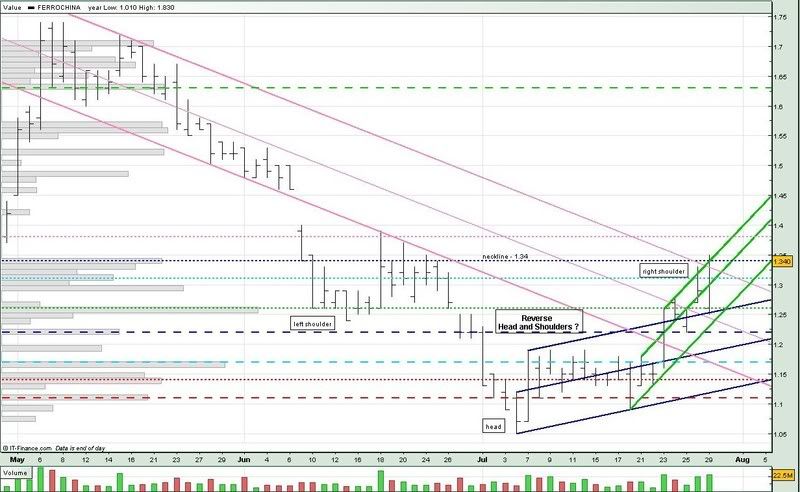
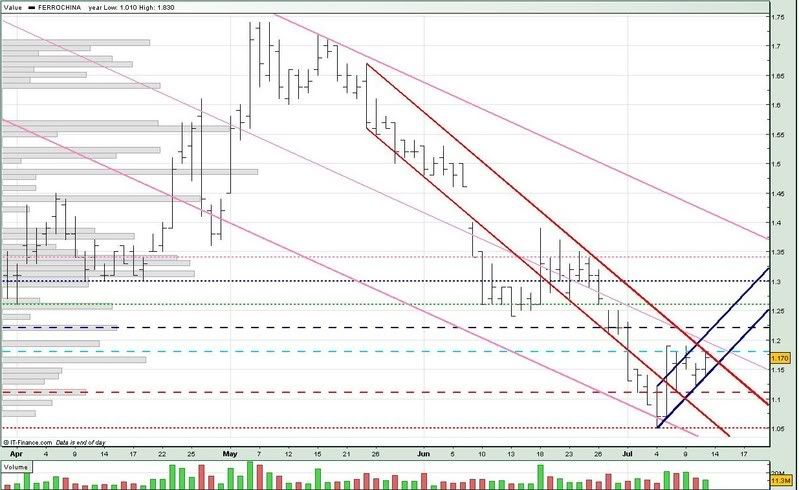
Ferro China 290708
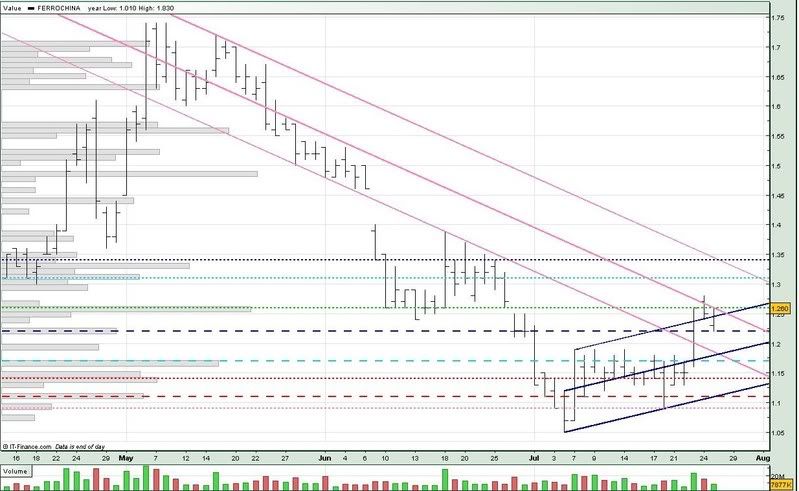
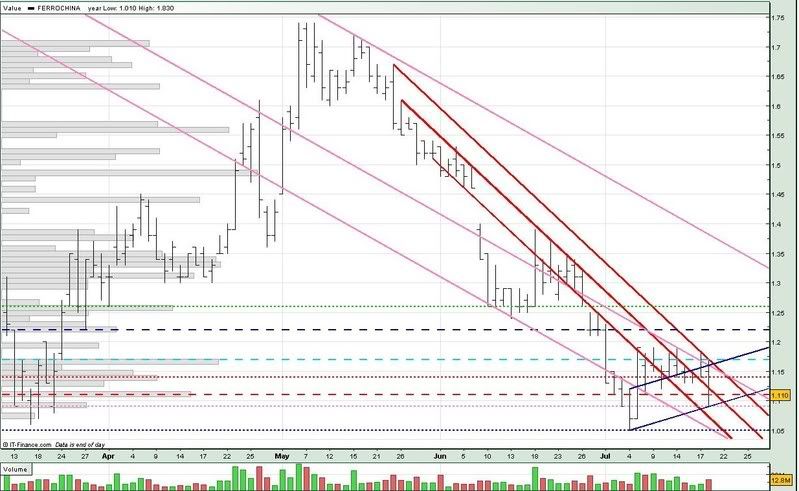
Ferro China continued its relentless push upwards, breaking the 1.31 resistance (light blue ...) and closing right on the 1.34 resistance (blue ...) and uptrend resistance (upp green). FerroChina also broke the long term downtrend resistance (upp pink).
Ferro China could also be forming the Reverse Head & Shoulders formation - with the left shoulder on 13 jun (1.24), Head on 4 jul (1.05) and right shoulder on 25 jul (1.22). I believe the right shoulder hasn't been completed yet, and we might see FerroChina testing the 1.34 neckline (blue ...) several more times.
The Reverse Head & Shoulders formation is quite a strong reversal indicator. Provided Ferro China successfully breaks the 1.34 neckline (blue ...). If that happens, we could potentially see FerroChina hitting a high of 1.63 (1.34 - 1.05 = 0.29, 1.34 + 0.29 = 1.63) which is the roughly the support level (green --) for FerroChina during the surge in price in may.
Of course, if Ferro China doesn't break the 1.34 neckline, its fall would be equally dramatic as its rise.
For tomorrow :
Support @ 1.34 (blue ...), 1.32 (upp pink, mid green), 1.31 (light blue ...), 1.26 green ...), 1.256 (upp blue), 1.247 (low green), 1.237 (mid pink), 1.22 (blue --)
Resistance @ 1.355 (upp green), 1.38 (pink ...). 1.40, 1.43
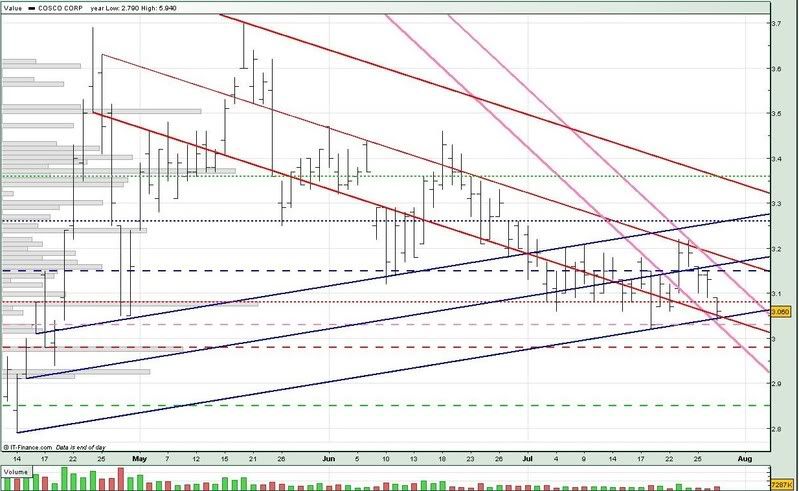
Cosco 290708
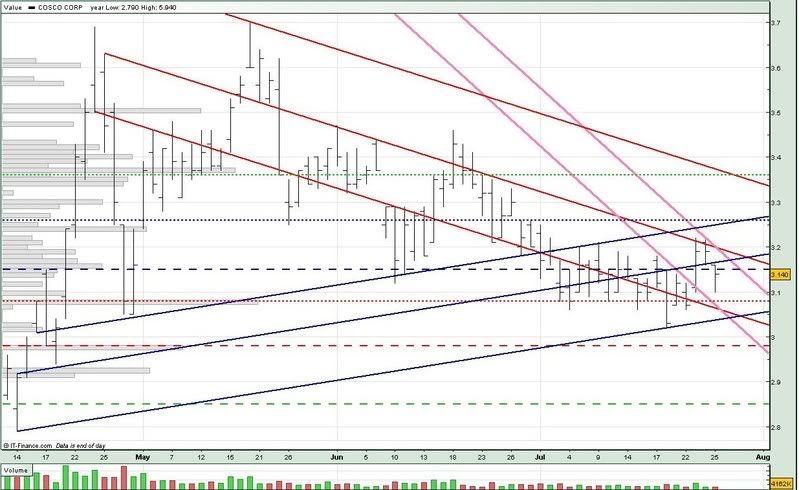
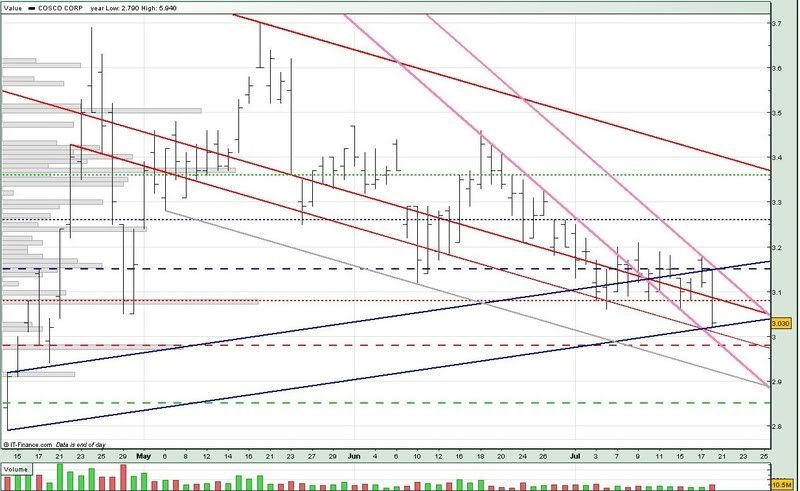
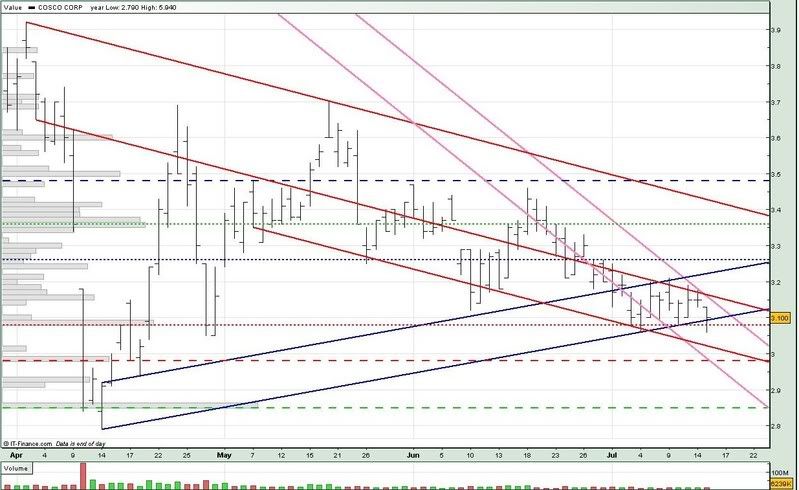
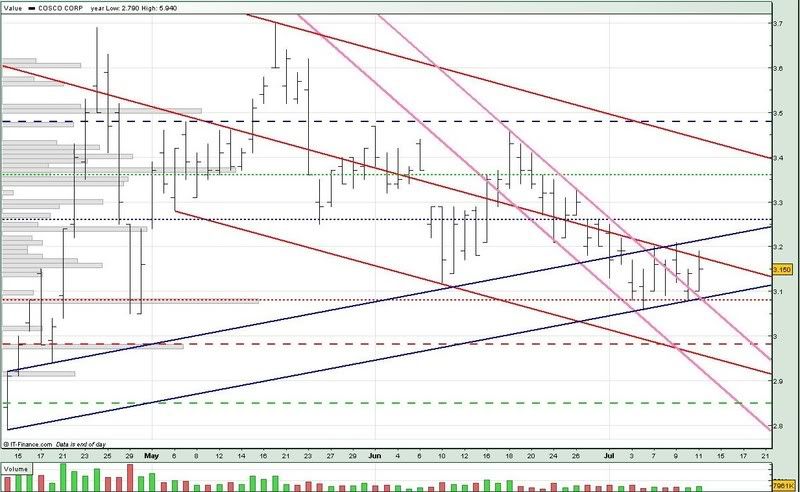
Cosco today broke the crucial 3.08 support (red ...) and tested the uptrend and downtrend supports (low blue, low red). Cosco also came within a whisker of testing the 3.03 support (pink --) and long term downtrend support (low pink).
If we take into account the last high volume day for Cosco was 23 jul, when it broke the 3.15 resistance (blue --), tomorrow would be T + 5. The situation could become bad if Cosco breaks the uptrend and downtrend supports (low blue, low red).
Worse, if Cosco breaks the 3.03 support (pink --) and long term downtrend support (low pink).
For tomorrow :
Support @ 3.048 (low blue), 3.044 (low red), 3.03 (pink --), 3.01 (low pink), 2.98 (red --)
Resistance @ 3.08 (red ...), 3.14 (upp pink), 3.15 (blue --), 3.165 (mid blue), 3.18 (mid red)
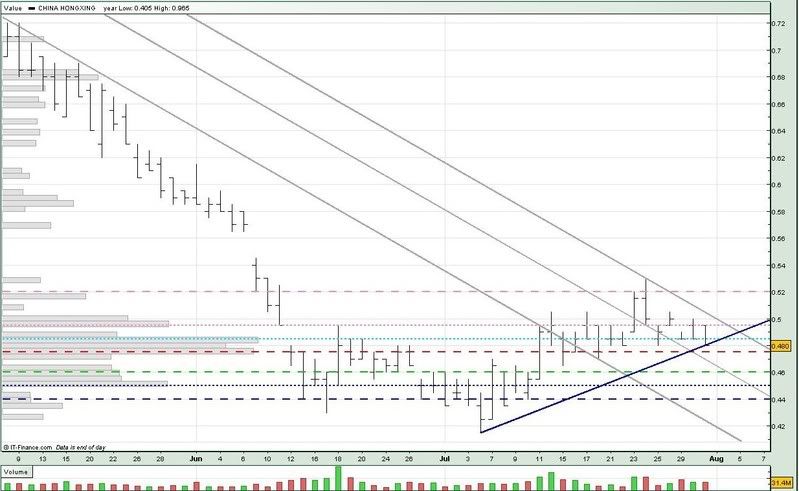
China HongX 290708
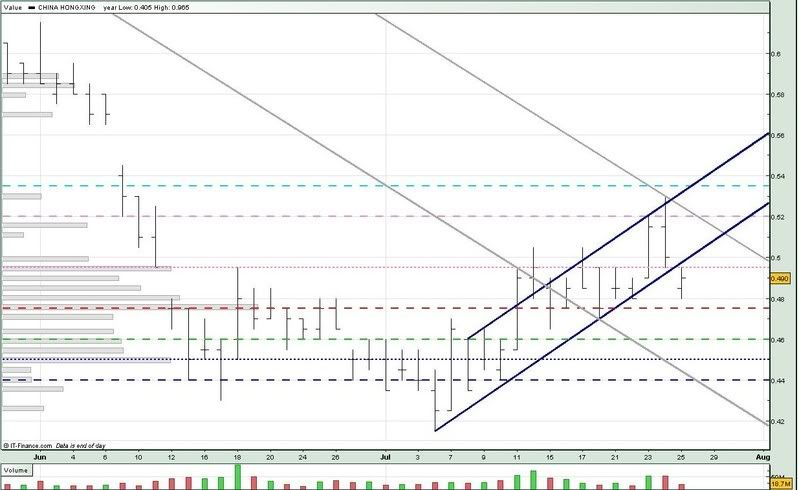
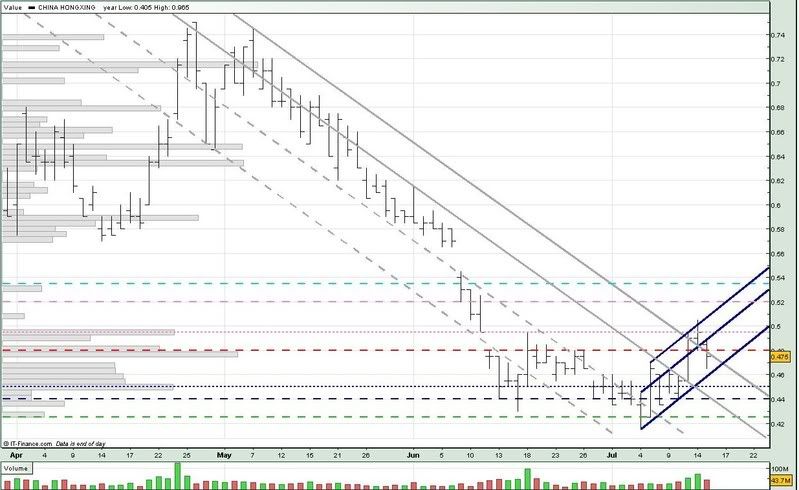
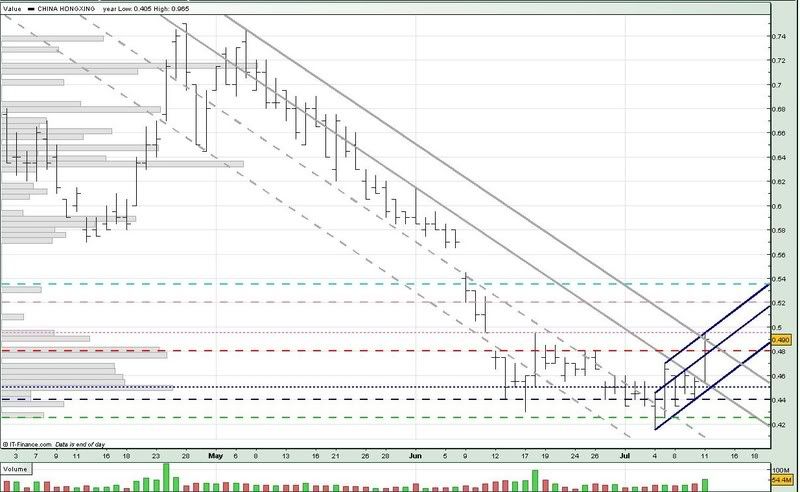
After breaking the uptrend support on 25 jul, China Hongxing today broke the uptrend support (low blue) again, and formed a Bearish Gravestone Doji, (as the trend prior to the Gravestone Doji was an uptrend). We now have even more people 'trapped' above the 0.495 resistance (pink ...).
Moreover, if we take into account 23 jul being the 1st day breakout, tomorrow would be the first T + 5 day. If China Hongxing doesn't break the 0.495 resistance (pink ...) soon, I don't see the 0.475 support (red --) holding on for long.
If the 0.475 support (red -- ) breaks, we could see China Hongxing testing the 0.460 (green --) support. If the reverse happens, China Hongxing has an even bigger resistance to overcome - the long term downtrend resistance (upp grey).
We should see some action by end of this week!
For tomorrow :
Support @ 0.485 (light blue ...), 0.475 (red --), 0.460 (green --), 0.450 (blue ...), 0.440 (blue --)
Resistance @ 0.493 (low blue), 0.495 (pink ...), 0.510 (upp grey), 0.520 (pink --)0.542 (upp blue)
Sunday, July 27, 2008
STX Pan Ocean 250708
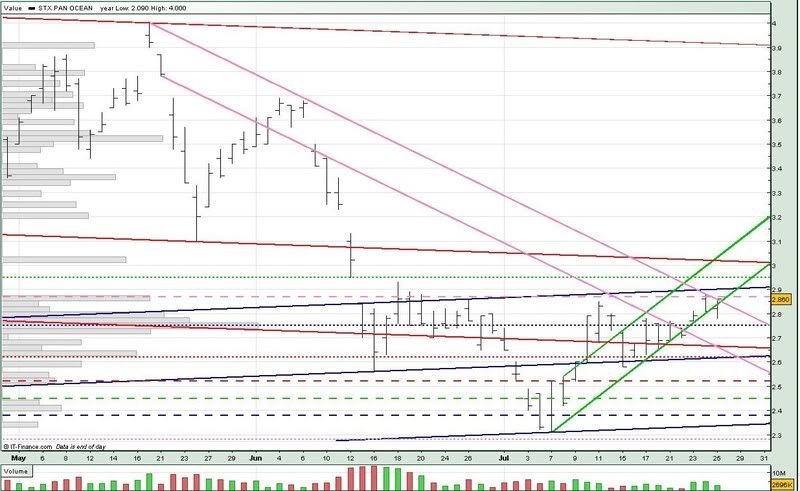
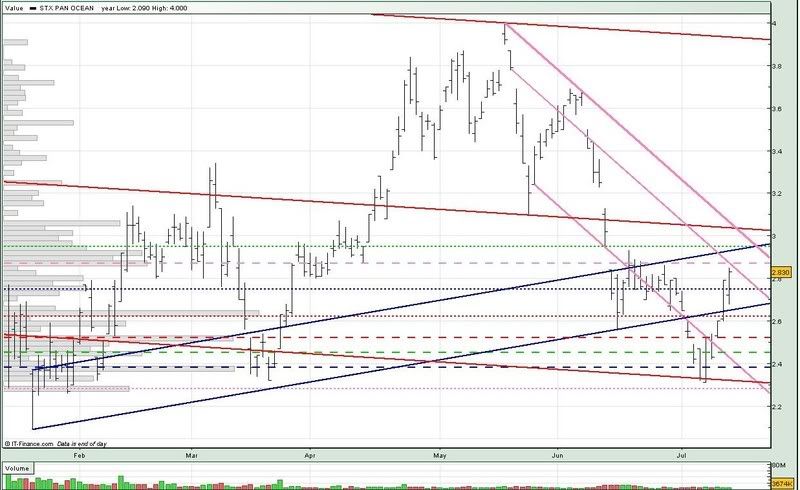
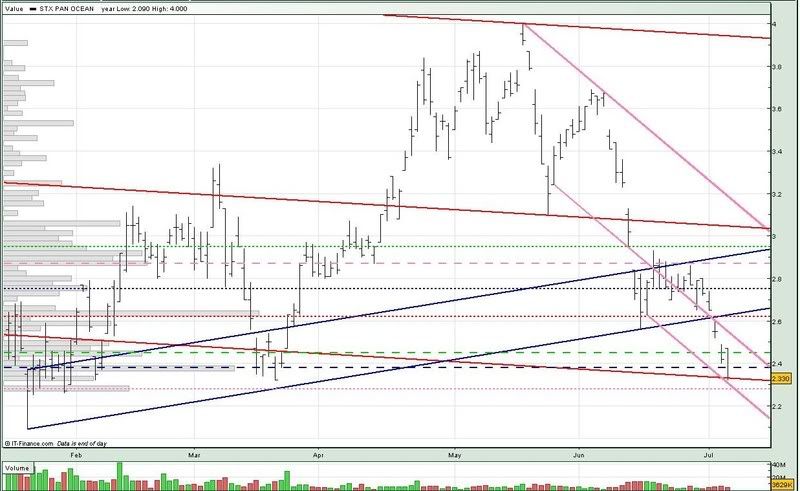
STX Pan Ocean managed to recover to trade above the 2.75 support (blue ...), but it is still capped byt the downtrend resistance (upp pink) and the 2.87 resistance pink --).
STX Pan Ocean also traded below the uptrend support (low green) before recovering to close just above the support today.
If STX Pan Ocean fails to break the 2.87 resistance, we could see it trading sideways, supported by the 2.75 support (blue ...).
However, if STX Pan Ocean breaks the 2.75 support, smiliar to what happened on 30 jun, we could see history repeating itself.
For monday :
Support @ 2.83 (upp pink), 2.75 (blue ...), 2.66 (low red), 2.64 (low pink), 2.62 (mid blue, red ...), 2.52 (red --)
Resistance @ 2.87 (low green, pink --), 2.90 (upp blue), 2.95 (green ...), 3.017 (mid red), 3.065 (upp green)
Saturday, July 26, 2008
Semb Marine 250708
After breaking the 4.12 neckline on 24 jul, Sembcorp Marine went on to break the uptrend support (low blue) and downtrend support (low red) today. Sembcorp Marine also tested the 4.00 support (blue ...) and came close to testing the long term downtrend support (low pink).
As mentioned on 11 jul, we could see Sembcorp Marine weakening further once the 4.12 neckline is broken. However, Sembcorp Marine started off today below the 2 supports (low blue, low red) and finished on a high, albeit still below the uptrend support (low blue).
Therefore, we may not see Sembcorp breaking the 4.00 support (blue ...) as yet, and would most likely see it trading sideways between the 4.00 support and 4.12 neckline (green --).
However, the probability of Sembcorp Marine breaking the 4.00 support increases each time it tests the 4.00 support. Likewise, for breaking out, if it continues to test the 4.12 neckline (green --).
For monday :
Support @ 4.03 (low red), 4.00 (blue ...), 3.96 (low pink), 3.94 (pink --), 3.86 (green ...)
Resistance @ 4.097 (low blue), 4.12 (green --), 4.18 (pink ...), 4.20 (upp red), 4.22 (red --)
Olam 250708
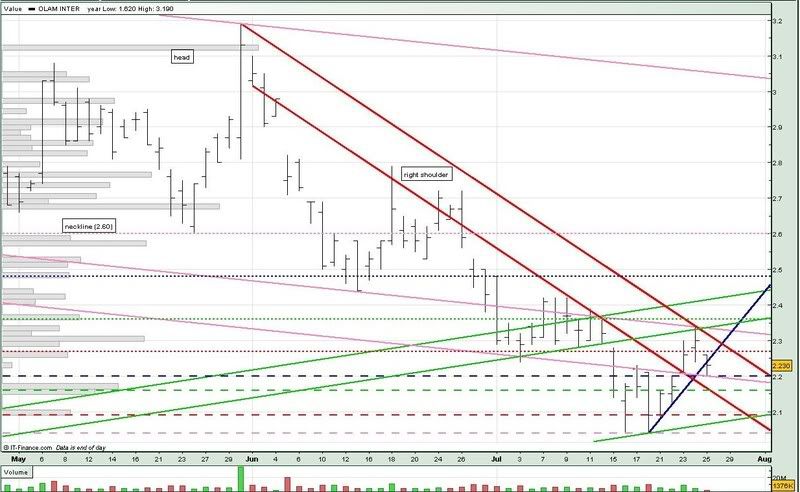
After hitting a low of 2.04 on 18 jul, Olam recovered some of its loss this week and is currently trading above the 2.20 support (blue --).
Olam also broke the short term uptrend support (blue) and tested the long term downtrend support (low pink) today. As you can see from the chart, Olam is still quite a long way from it peak of 3.19 on 30 may.
If the 2.20 support (blue --) holds, we could see Olam trading sideways between the 2.20 support and 2.27 resistance (red ...).
For monday :
Support @ 2.20 (low pink, blue --), 2.16 (green --), 2.14 (low red), 2.09 (red --), 2.07 (low green)
Resistance @ 2.27 (red ...), 2.28 (blue), 2.30 (mid red), 2.33 (mid pink), 2.34 (mid green), 2.36 (green ...)
Friday, July 25, 2008
Indofood Agri 250708
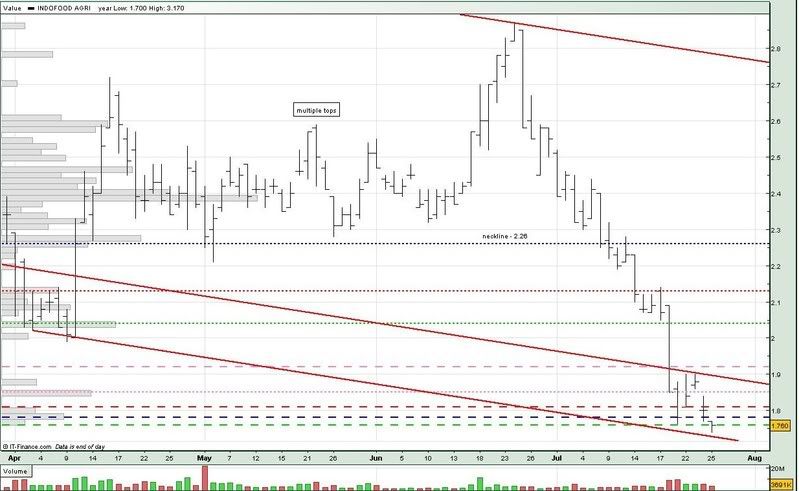
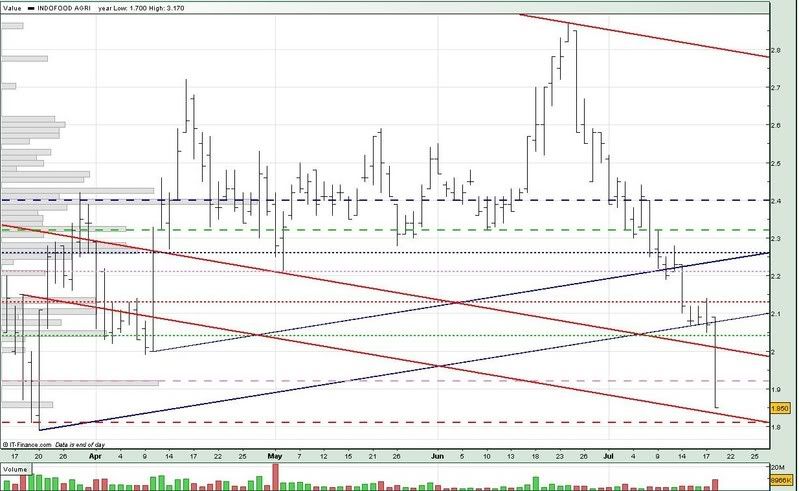
Indofood Agri almost tested the 22 jan low of 1.70 as it continues to trade within the downtrend channel (red). Indofood Agri also couldn't hold onto its 1.81 support (red --), breaking it today, and almost testing the downtrend support (low red).
You can see from the chart that Indofood Agri acutally formed multiple tops - starting from 16 apr (2.72) to 24 jun (2.82). The support neckline looks to be 2.26 as Indofood Agri broke out from that level on 11 apr.
This gives us a difference (2.82 - 2.26) of 52 cents. Again, taking the difference (2.26 - 0.52) gives us a value of 1.74, which coincidentally is the low for today, and also the lowest level Indofood Agri has hit since the 22 jan low.
What this means is that 1.74 could be a crucial support for Indofood Agri, and it could be hitting the bottom already.
However, if Indofood Agri breaks this support as well, we could see it retreating all the way to the 1.20 to 1.30 level, which is where it broke out previously in Oct 2007.
For monday :
Support @ 1.76 (green --), 1.74 (neckline support), 1.72 (low red), 1.70 (22 jan low)
Resistance @ 1.78 (blue --), 1.81 (red --), 1.85 (pink ...), 1.89 (mid red), 1.92 (pink --), 2.04 (green ...)
Ferro China 250708
Ferro China burst back into life after testing the 1.09 support (pink ...) and uptrend support (low blue) on 18 jul. FerroChina also broke the previous long term downtrend resistance (low pink) and 1.22 neckline (blue --) on 23 jul.
Although Ferro China has managed to stay above this neckline so far, we can also see that volume is gradually falling. From the chart, we can also see that the long term downtrend resistance (mid pink) meets the uptrend resistance (upp blue) 1.25 level. So we might see somemore action next week.
If FerroChina can open above the 1.25 level, and/or break the 1.26 resistance (green ...), we could see FerroChina exploding up for another round, possibly testing the 1.31 resistance (light blue ...).
Otherwise, we could see more profit-taking next week, with Ferro China testing the uptrend support (mid blue), and 1.17 support (light blue --).
For monday :
Support @ 1.25 (mid pink, upp blue), 1.22 (blue --), 1.183 (mid blue), 1.177 (low pink), 1.17 (light blue --), 1.14 (red ...)
Resistance @ 1.26 (green ...), 1.31 (light blue ...), 1.33 (upp pink), 1.34 (blue ...)
Cosco 250708
Cosco recovered after testing the 3.08 support (red ...) twice, to trade above the 3.15 resistance (blue --). However, Cosco is still trading within the downtrend channels (pink, red).
Given the current market sentiments, we could see Cosco continue to trade sideways within the 3.08 support (red ...) and 3.15 resistance (blue --).
Volume remains relative low.
For monday :
Support @ 3.08 (red ...), 3.05 (low pink, low red), 3.04 (low blue), 2.98 (red --)
Resistance @ 3.17 (mid blue), 3.18 (upp pink), 3.19 (mid red), 3.25 (upp blue), 3.26 (blue ...)
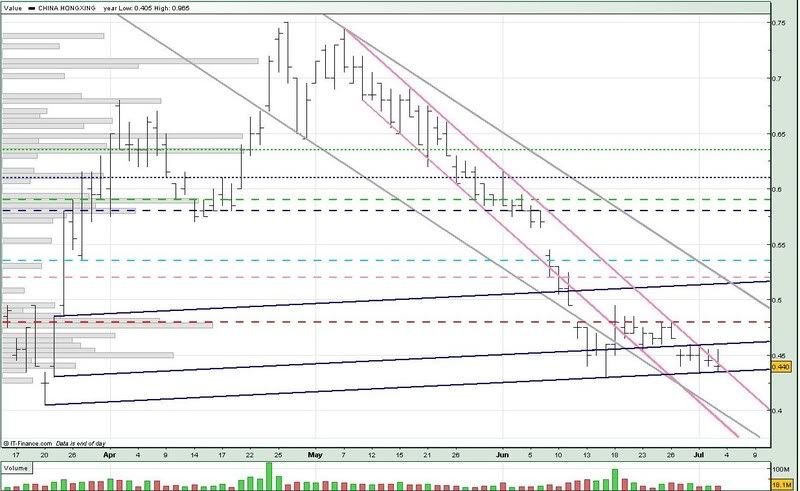
China HongX 250708
On 23 Jul, China Hongxing broke the 0.495 resistance (pink ...) with volume, and also tested the 0.520 resistance (pink --). The next day saw almost the same trading patter and high volume.
And today, China Hongxing broke the uptrend support (low blue) and 0.495 support (pink ...). What this means is there are now more people 'trapped' at levels 0.495 and higher.
If China Hongxing holds onto its 0.475 support (red --), we could see it trading range bound between 0.475 and 0.495 (pink ...).
For monday :
Support @ 0.475 (red --), 0.460 (green --), 0.450 (blue ...), 0.440 (low grey, blue --)
Resistance @ 0.495 (pink ...), 0.503 (low blue), 0.520 (upp grey, pink --),0.535 (upp blue, light blue --)
Why blame 'speculators' for oil price run-up?
by LEON HADAR (25 July)
Their upward pressure on prices drives down demand; falling demand leads to lower prices
DEMOCRATIC and Republican lawmakers in Washington, led by the two presumptive presidential candidates, have been blaming 'speculators' for some of America's current economic problems.
They indict these people for rising energy prices and the housing market mess. And they want the government to take action against energy traders, short-sellers and other evil-doers.
Senator Barack Obama has promised voters that as president he would strengthen government oversight of energy traders. He has blamed them for the skyrocketing oil prices.
Senator John McCain has called for a 'thorough and complete investigation of speculators' to see if they have been driving up energy prices.
At the same time, responding to pressure from Capitol Hill where lawmakers have placed the responsibility for some of the turmoil in financial shares on short-selling investors, the US Securities and Exchange Commission (SEC) is promoting its effort to curb speculation in financial services stocks, most notably hedge funds. Among other moves, it has introduced new short-selling rules, listing 19 banks and investment banks which cannot be shorted.
The reason for the current obsession in Washington with speculators is simple. Americans - aka voters - are angry about the rising oil prices and shocked by the mayhem in the financial and housing markets.
Since the average American is economically illiterate and is certainly not familiar with the intricacies of global financial and energy markets, he or she will search for simple explanations for their current misery: the federal government - the President and Congress. In this age of the nanny State with its power of regulation, they were supposed to ensure that such bad things don't happen.
Lawmakers and officials, on the other hand, encourage Americans to shift the blame to other targets against which they could vent their rage.
Hence the tendency in Washington to bash the Chinese and the greedy CEOs when American manufacturing jobs disappear, or to scapegoat the oil companies and energy speculators when oil prices rise or to fault hedge funds and short-sellers when stock prices fall.
After all, as they used to ask in Rome: 'Cui bono?' Who Benefits? Since those who invested in commodities in recent years seem to have profited from the commodity price boom which they had predicted, doesn't it make sense to blame them for causing the price hikes?
And aren't short-sellers hoping for bad things to happen to stock prices, suggesting that there is perhaps a direct connection between short-selling and falling stock prices?
It's not surprising, therefore, that these speculators are being depicted in the media, which echoes the spin of the politicians in Washington, as evil geniuses, who through the power of their perfect foresight and flawless investment strategy, have succeeded in exploiting the misery experienced by the rest of us.
For example, I was watching investor and short-seller Jim Rogers being interviewed on CNBC business news programme recently, during which he was accused by a reporter of 'talking down' the stocks of Fannie Mae and Freddie Mac and making them insolvent.
Forget the decades of mismanagement and waste by these two Washington behemoths, privileged through government cronyism. It's Mr Rogers and his fellow short-sellers who are responsible for their disastrous performance.
That short-sellers are not popular with investors who have a stake in seeing certain stock prices go up is understandable. But to say Mr Rogers is responsible for the troubles afflicting America's two mortgage giants is the equivalent of blaming medical researchers who predict a rise in the rate of cancer, as causing the spread of that disease.
And the fact that those medial researchers would benefit from the flow of more grants to help them find cure for cancer won't lead us to malign them as 'profiteers' either.
Indeed, not unlike a medical doctor who discovers that his patient is sick (and will therefore be required to visit the doctor - and pay for his services - several more times) or an investigative reporter who uncovers government corruption (and wins fame and fortune), short-sellers also 'benefit' from the problems faced by others.
Short-selling - very much like hostile takeovers - provides a critical source of accurate information for the players in the market by discovering problems confronting certain firms, suggesting that the current high prices are an over-estimation of their real value.
That kind of information should be valuable to other market participants who could take advantage of it and correct their mistakes. The short-seller will continue to make huge profits if these participants dismiss his information and insist on listening to the optimistic information provided by the cheer-leaders who are interested in continuing to boost the stock prices of the troubled firm.
But even the most successful short-seller cannot force prices for a long time if other market participants discover that his information doesn't correspond with reality,
Restricting short-selling is akin to shooting the messenger if he happens to be a bearer of bad news. It assumes that deflating false expectations is a process that should be prohibited by society while cheer-leading should be encouraged.
As the current mess in Fannie Mae and Freddie Mac demonstrates, the short-sellers seem to have played the role that should have been performed a long time ago by the respective government regulators - detecting the problems facing these two companies.
Similarly, contrary to their perception as malevolent speculators who are driving oil prices up, energy traders are actually helping make the market more efficient. Indeed, challenging a 'fundamental misperception' about 'so-called speculators' driving oil prices to 'supposedly unjustified levels', a 'super-spike' report issued by Goldman Sachs earlier this year concluded that it was just the other way around.
Energy traders were helping to 'solve the energy crisis' by providing incentives for more capital spending on alternative energy. And the Goldman Sachs report questioned the economic logic behind the plans proposed by the administration and Congress to place restrictions on energy trading.
'It is not speculators moving the market, it is the information on forward supply and demand fundamentals that they are conveying,' the Goldman Sachs report said. The removal of speculators from commodity markets would force the market 'to function with less informed views, degrading the price discovery mechanism,' the report said.
New York Mayor Michael Bloomberg is one of the public figures who have been insisting that it would be a mistake to blame the global run-up in energy prices on speculators.
'The big run-up is not because of speculators,' Mr Bloomberg told WNYC television in New York. 'The big run-up is because more and more people are using energy.'
Indeed, the rise in energy prices is being driven by structural factors, including the increasing demand sparked by the growth of China, India and other emerging markets. At the same time, supply of oil has fallen in the US, Mexico and Venezuela and other oil-producing countries. There was also a political factor in the price: traders expected US attack on Iran - with all its implications for the flow of oil down the Gulf. Now that there are hints of a shift in US policy, the oil price is coming down.
In any event, speculators help drive down demand when they put upward pressure on prices. And falling demand leads eventually to lower oil prices. In that case, commodity speculators could take short positions and contribute to falling oil prices.
One wonders if American officials, lawmakers and the media would then praise the speculators for the falling energy prices or accuse them of short-selling.
-Editorial Report by LEON HADAR (25 July)
Thursday, July 24, 2008
China Milk Research Report
by DMG & PARTNERS (24 July)
CHINA Milk is currently benefiting from China's dairy consumption boom.
According to United Nations statistics, total dairy consumption in China reached 19 million tonnes in 2006. By 2008, it is expected to surpass 25 million tonnes.
This growth would peg China's total market size ahead of major European dairy markets such as France and Germany.
We believe that China Milk, which is currently the largest producer of pedigree bull semen, cow embryos, and raw milk in China, is going to benefit from these trends. We initiate coverage on China Milk with a target price of S$0.99.
The rationale for China Milk lies within its outlook, strategy, and plans going forward.
Our justification is simple.
Firstly, the company is in a strong net cash position of 726.5 million yuan (0.98 yuan per share) to expand its business even further.
With a total herd size of 18,390 as at end-March, the company is looking to double its current size by FY2010 through purchasing more Canadian and Australian Holsteins. The cost of one Canadian Holstein is nearly double that of an Australian Holstein's 28,000 yuan.
Currently China has an import ban on Canadian Holsteins due to the mad cow disease. We believe the government may lift the ban by FY2010.
On top of doubling its herd size, the company is expanding its business downstream through milk processing.
This will further strengthen China Milk as a major player in the dairy business. We expect further growth earnings in FY2009, fuelled by the increasing demand for dairy products in China.
Long-term outlook looks attractive with the group planning to increase its herd size which will enable them to produce more bull semen, cow embryo, raw milk, and processed milk.
We conservatively estimate earnings to grow 15 per cent to 552.5 million yuan in FY2009, and 11.2 per cent to 614.5 million yuan in FY2010.
We have a price target based on a forward FY2010 PE of 6 which is a FY2010 PE-to-growth ratio of 0.5. This implies an upside of 42 per cent from current levels. China Milk is currently trading at a FY2009 PE of 4.7 and a forward FY2010 PE of 4.2, which is considerably lower compared to its regional peers' FY2009 PE of 20.2.
-Research Report by DMG & PARTNERS (24 July)
Wednesday, July 23, 2008
Olam needs to translate M&A deals into results
by EMILYN YAP (23 July)
OLAM International captured the market's attention early this month with two key transactions within one week.
The commodity supply chain manager kicked off July with news of a joint venture with palm oil group Wilmar International to invest in natural sweetener producer PureCircle. This was followed quickly by news on July 8 that it made a stake purchase in Dairy Trust, a dairy processor in New Zealand.
Given Olam's penchant for growth, chances are that it is already pounding out the script for more acquisitions within the financial year.
Close watchers of Olam would have noted that as early as 2005, it was already anticipating that its organic growth rate would slow by end-2011 as it became the market leader in most of its businesses.
Mergers and acquisitions (M&As) would support further growth, and Olam has since drawn up a large universe for expansion by looking at new geographies, product spaces and value chain stages.
In FY2007/08, Olam spent some US$399 million extending its reach into sectors such as cotton, palm oil, rubber and sugar.
So while recent purchases have streamed in quickly, they are but part of the growth plan and Olam still has considerable room for more. Under its M&A policy, deal values in the financial year should not exceed 15 per cent of market capitalisation.
Olam has only spent US$129.9 million on PureCircle and Dairy Trust so far in FY2009, which is a far cry from the guideline's ceiling of around US$410 million today.
Recent fund raisings have boosted Olam's purchasing power as well, and its stakes in PureCircle and Dairy Trust would nary cause a dent to the war chest. Olam has raised more than US$500 million through a preferential share offering and convertible bond issue, and could gain another US$100 million if it exercises the option to issue more convertible bonds.
To quote CEO Sunny Verghese following the bond issue, 'Olam is now very well positioned financially to capitalise on the numerous organic and acquisition growth opportunities open to us'.
Acquisitions are also easier if there is a partner to help maximise returns and share costs and risks. Olam may have found a kindred spirit in Wilmar, seeing that the joint venture in PureCircle is already the second team-up for both groups.
While it is anyone's guess as to whether more collaborations between the two will materialise, success from the latest partnership would pave the way for more to come.
In another indication of what could come next, an Olam spokesman also told BT that the company's deal pipeline remains strong.
Going by the signs, further growth is on the cards for Olam. Investor response has been cool though, and the counter has slid some 10.7 per cent since end-June to close at $2.17 yesterday.
Apart from general market pessimism, investor caution could also be at play. Questions being asked are whether there are plans to raise more funds to fuel growth and whether these would lead to earnings dilution.
Another concern is whether the group has sufficient resources to manage and monitor all its new interests. The more prudent investors will prefer to see Olam reap results from its expansion forays before buying into the growth story, and this is where Olam needs to prove its worth.
-Editorial Report by EMILYN YAP (23 July)
CH Offshore Research Report
by Kim Eng Research (23 July)
CH OFFSHORE (CHO) has been carrying out a series of disposals and purchases over the last two years to revitalise its fleet and expand its capabilities to operate in deeper water. With its renewed fleet, CHO is in a sweet spot to capture this oil and gas (O&G) offshore sector upswing.
We estimate that CHO will gain US$12 million from the disposal of the last four vessels built before 1984, which will be accounted for by FY2009. As of FY2010, the group will have a relatively young fleet of 15 vessels, all less than 10 years of age, far lower than the global age of 25 years for anchor handling tug supply vessels.
Its total capacity will be boosted by 56 per cent to 136,306 brake horse-power. Net gearing will remain at a low of 10-20 per cent after financing for the newbuilds. We estimate that the Ebit contribution from its total fleet will be US$54 million by 2010.
Based on our estimates, if Scomi Marine sells its 29 per cent stake in CHO, it would be sacrificing a sizeable share of the associates' profits in the amount of US$12 million-US$14 million, as well as an estimated S$3 million-S$10 million in cash dividends in FY2008-10. We believe that Scomi shareholders are unlikely to cash out from this growing cash cow in the short term.
CHO will likely flourish in the next two years as newbuilds come on-stream, and it is expected to rake in pre-exceptional EPS y-o-y growth of 70 per cent in 2009 and 40 per cent in 2010. We estimate CHO's FY2008 RNAV to be conservative at US$282 million or around S$0.55 per share, translating into a mere 1.1 times RNAV.
CHO, a forgotten gem in the making, is relatively cheap in terms of prospective PE and enterprise value/Ebitda.
-Research Report by Kim Eng Research (23 July)
Tuesday, July 22, 2008
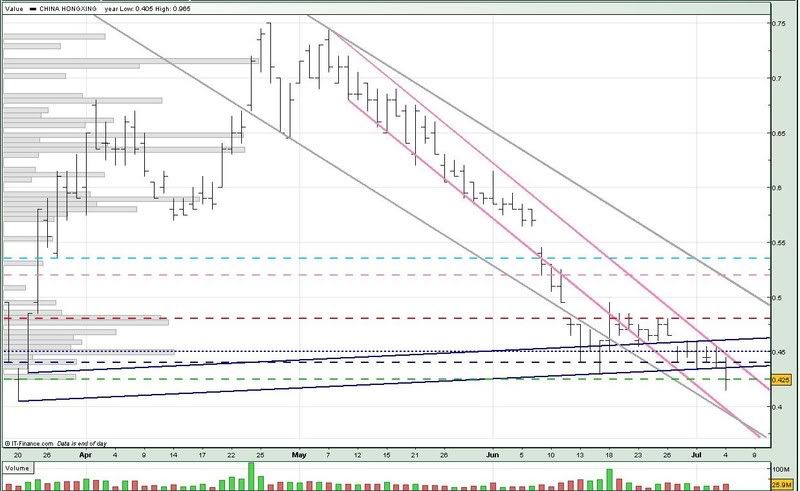
China HongX 220708
China Hongxing closed right on the uptrend support today. We are somewhat at a crossroad for China Hongxing. As you can see from the chart, the long term downtrend resistance (upp grey) meets the uptrend support tomorrow at around the the 0.485 level.
Given that China Hongxing has been trading sideways recently, and there being a breakout on 11 jul, the chances of China Hongxing breaking out again is quite slim. Moreover, the 0.495 resistance (pink ...) has proved quite stubborn so far. However, based on volume distribution, the 0.475 support (red --) has also been quite resilient so far.
Therefore, we could still be looking at China Hongxing consolidating (trading sideways) further for the time being. If China Hongxing does break the 0.495 resistance (pink ...), do confirm with an increase in volume. Likewise for a breakdown in the 0.475 support (red --).
For tomorrow :
Support @ 0.475 (red --), 0.460 (green --), 0.450 (low grey, blue ...), 0.440 (blue --)
Resistance @ 0.485 (low blue, upp grey), 0.495 (pink ...), 0.515 (upp blue), 0.520 (pink --)
STI rebound looks likely to be short-lived
by KELive Research (22 July)
THE Straits Times Index (STI) fell below our target of 2,832 to 2,819, and then rebounded as expected.To recap, global markets went into a tailspin last week over concerns that Fannie Mae and Freddie Mac may be nationalised and mortgage-backed securities would face another cycle of de-rating. Fortunately, crude declined from US$147/bbl and closed at US$128.88/bbl, easing sentiment to some extent.
These developments have not swung our view on the market's downtrend. We believe the rebound is likely to be short-lived as the STI is fast approaching the resistance levels of 2,960 and 3,000.
The good news is that the STI may have found bottom at 2,819 for the short term as bullish divergence has been detected in the RSI; MACD indicators are also positive at the 2,800 levels.
Any rebound should be a selling opportunity for investors.
There are adverse implications of 2,946 failing because this support level represents the 61.8 per cent Fibonacci retracement of the March-May advance. Based on Fibonacci theory, we now believe there is a high likelihood of the STI falling towards 2,745.
Sell into strength.
-Research Report by KELive Research (22 July)
Sembmarine unit wins US$220m rig contract
Egyptian Drilling's second jack-up rig order for PPL
SEMBCORP Marine subsidiary PPL Shipyard has won a deal from repeat customer Egyptian Drilling Company (EDC) to build a jack-up rig with a contract value of US$220 million.
Scheduled for delivery in mid-2010, the rig is the second that EDC has ordered from PPL Shipyard.
It will be based on the same Baker Marine Pacific Class 375 (BMC Pacific 375) Deep Drilling design and proprietary components. It will be able to drill high pressure and high temperature wells at 30,000 feet while operating in 375 feet of water.
It will have accommodation with full catering and amenities for 120 people. The first EDC rig, now under construction by PPL, is scheduled to be delivered in December 2009.
Since the launch in 2004 of the BMC Pacific 375 class, 24 jack-up rigs based on this design have been ordered.
Sembmarine said that 11 have already been delivered, with 13 others in various planning, engineering and construction phases for delivery between 2008 and 2010.
The latest contract is not expected to have any material impact on Sembmarine's net tangible assets or earnings per share in the current financial year.
So far, PPL has built and delivered more than 32 jack-up rigs of various designs and specifications, as well as four semi-submersible rigs.
Monday, July 21, 2008
Oil prices drag down most commodities
by AFP (21 July)
(LONDON) Oil prices slumped last week as traders worried the slowing US economy would dampen demand from the world's biggest energy consumer, sparking losses across other key commodity markets.
Oil: Crude futures plummeted further from record high points above US$147 per barrel that were struck exactly one week ago. By Friday, Brent North Sea crude for September delivery dived to US$132.30, sharply down from US$144.15 a week earlier. New York's main oil futures contract, light sweet crude for August plummeted to US$131.15 from US$146.55.
Coffee: Coffee prices dipped after the sharp drop in oil. By Friday on Liffe, Robusta for September delivery fell to US$2,373 per tonne from US$2,361 a week earlier. On the NYBOT, Arabica for September delivery slid to 137.50 US cents per pound from 142.62 cents.
Labels:
ChinaA Oil,
IndoAgri,
Olam,
Research Reports,
SPC
China HongX Research Report
by Kim Eng Research (21 July)
Retail sales in China jumped by 23% y-o-y in June, reflecting the still buoyant domestic consumption. The group's strong net cash position of 2.6b renminbi (SGD500m) or 19cents per share will facilitate its expansion plans.
Its placement of 400m new shares in nov 2007 raised approximately 2.3b renminbi, and will be mainly used for the expansion of its sales and distribution network and for advertising and promotional activities.
Gross margin in FY2008 is likely to stay flat at around 41% due to the product discount programme that will last until 1Q2009. The group is confident of reverting to a 2%-point annunal increase in gross margin by FY2009.
China Hongxing's share price has corrected 50% year-to-date, and is trading at a discount to its peer average of 15x FY2008 PER.
-Research Report by Kim Eng Research (21 July)
Sunday, July 20, 2008
SGX 180708
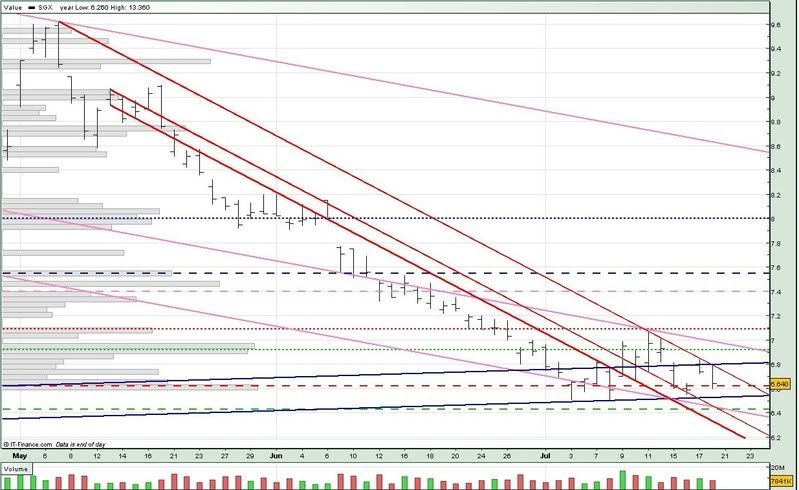
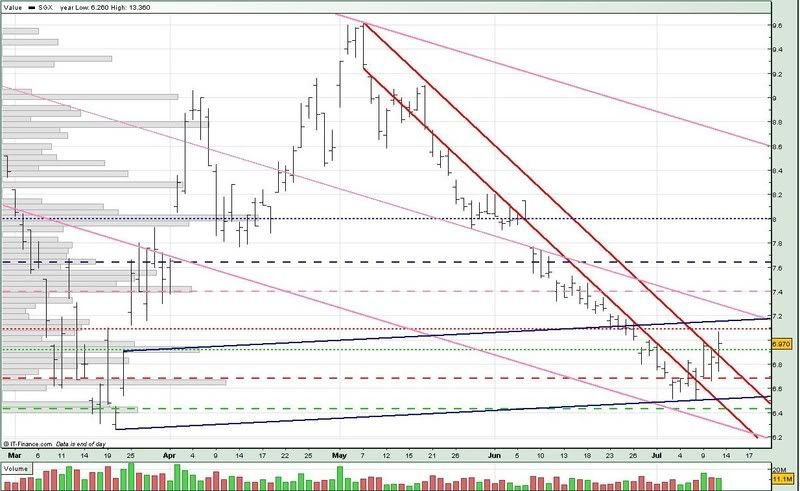
SGX continues to trade within the downtrend channel (red), and has also tested the 6.62 support (red --) 3 times this week. If the 6.62 support is broken, we could see SGX testing the 6.43 support (green --).
For monday :
Support @ 6.62 (red --), 6.52 (low blue), 6.43 (low pink, green --), 6.40 (mid red), 6.27 (low red)
Resistance @ 6.74 (upp red), 6.80 (upp blue), 6.92 (green ...), 6.97 (mid pink), 7.09 (red ...)
For monday :
Support @ 6.62 (red --), 6.52 (low blue), 6.43 (low pink, green --), 6.40 (mid red), 6.27 (low red)
Resistance @ 6.74 (upp red), 6.80 (upp blue), 6.92 (green ...), 6.97 (mid pink), 7.09 (red ...)
Semb Marine 180708
After breaking the 4.22 support (red --) on 15 jul, Sembcorp Marine has now tested the 4.12 support (green --) 3 times. As mentioned previously, we could see Sembcorp Marine retreating further if the 4.12 support is broken.
Of course, that would mean that Sembcorp Marine breaking the 4.00 support (blue ...) as well as the long term downtrend support (low pink).
However, we may see Sembcorp Marine trading sideways intially, between the 4.22 resistance (red --) and 4.12 support (green --).
For monday :
Support @ 4.12 (green --), 4.053 (low red), 4.045 (low blue), 4.00 (blue ...), 3.99 (low pink), 3.94 (pink --), 3.86 (green ...)
Resistance @ 4.18 (pink ...), 4.22 (upp red, red --), 4.235 (mid blue), 4.26 (mid pink), 4.30 (blue --), 4.37 (upp blue)
Saturday, July 19, 2008
Olam 180708
Olam tested the 2.04 support (pink --) the next day after I posted my last analysis on Olam (15 jul). It tested the 2.04 support again today, but closed right on the 2.09 support (red --).
Olam is another one of those commodity counters that have been badly hit, although its decline wasn't as dramatic as Indofood Agri's, but just as bad (or even worse) if you look at the amount it has lost since its peak of 3.19 on 30 may - lost 1.15, which is about 36% !
If the commodity sector continues to weaken, we could see Olam revisiting the 1.62 low it hit on 20 mar. We could see Olam repeating its trading pattern like those in june and early july, whereby it traded sideways before weakening to a new low.
For monday :
Support @ 2.09 (red --), 2.06 (mid red), 2.03 (low pink, pink --, low green), 1.94 (low red)
Resistance @ 2.16 (green --), 2.20 (blue --), 2.21 (mid pink), 2.27 (red ...), 2.30 (upp red)
Indofood Agri 180708
Indofood Agri has managed to lose 1.02 since its peak of 2.87 on 27 jun, that's more than 35% within a period of less than a month! As you can see from the chart, Indofood Agri has since broken many supports on its steep plunge down.
We could see Indofood Agri testing the 1.81 support (red --) next week, and trading sideways between the 1.81 support and 1.92 resistance (pink --).
If Indofood Agri breaks the 1.81 support, we could see it revisiting the 1.70 low which it hit on 22 jan.
For tomorrow :
Support @ 1.83 (low red), 1.81 (red --), 1.74, 1.70 (22 jan low)
Resistance @ 1.92 (pink --), 2.01 (mid red), 2.04 (green ...), 2.08 (low blue), 2.13 (red ...)
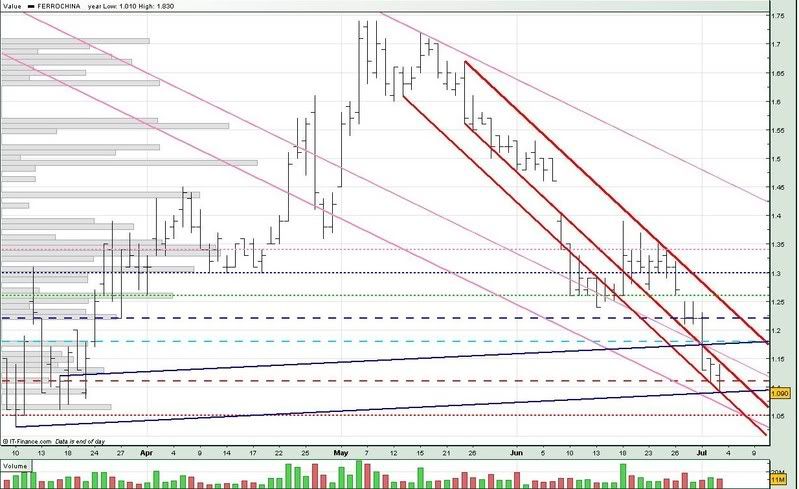
Ferro China 180708
Ferro China did open at 1.16 on 14 jul. It even tested the long term downtrend resistance (mid pink) before closing on the 1.17 resistance (light blue --) on 14 jul.
But more importantly, FerroChina also tested the 1.14 support everyday since 14 jul, and it finally broke it today, tested the 1.09 support (pink ...), before closing right on the 1.11 support (red --) today, which was quite close to what I've said on 11 jul.
If Ferro China breaks the 1.09 support (pink ...), we could see it test the 1.07 support (based on volume distribution) first. And if the 1.07 support holds, we could see FerroChina trading sideways.
If the 1.07 support breaks, we could see Ferro China testing the 1.05 support (blue ...), which is also the support indicated by the long term downtrend support (low pink).
For monday :
Support @ 1.093 (low blue), 1.09 (pink ...), 1.07, 1.06 (low red), 1.05 (blue ...), 1.047 (low pink)
Resistance @ 1.11 (mid red, red --), 1.14 (red ...), 1.153 (mid pink), 1.158 (upp red), 1.163 (upp blue), 1.17 (light blue --)
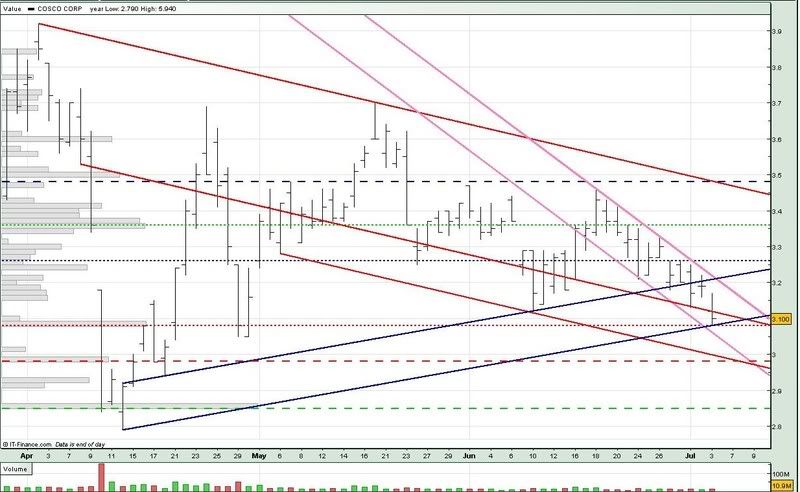
Cosco 180708
After testing the 3.08 support (red ...) 3 times, Cosco finally broke it today, even coming close to testing the downtrend support (low red).
There is now a very high chance we might see Cosco opening below the 3.08 support (red ...) and if that happens the 3.08 level would become quite a formidable resistance. Also, we might then see Cosco go on to test the 2.98 support (red --) too. And trading would probably be between the 3.08 resistance and 2.98 support.
For monday :
Support @ 3.02 (low blue), 3.00 (low red), 2.98 (low pink, red --), 2.92 (grey), 2.85 (green --)
Resistance @ 3.08 (mid red, red ...), 3.13 (upp pink), 3.15 (upp blue, blue --), 3.26 (blue ...)
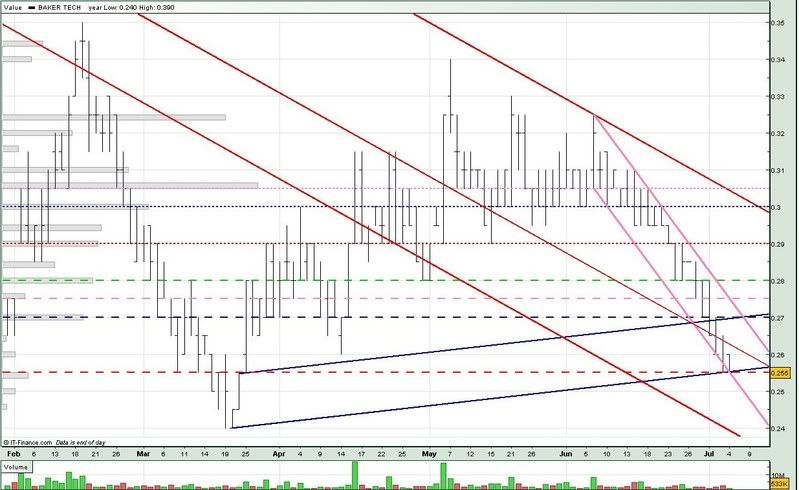
BakerTech 170708
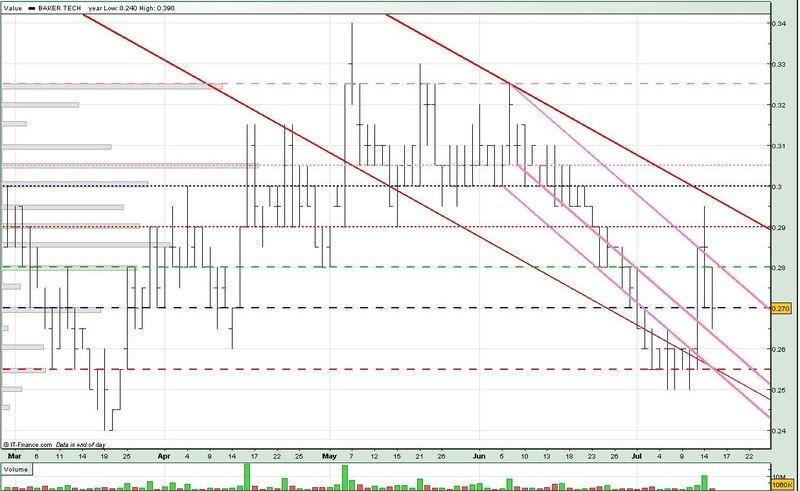
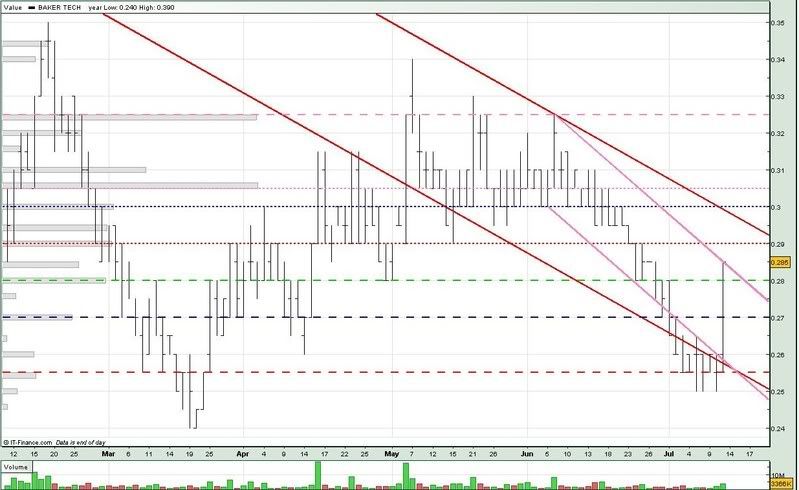
BakerTech still continues to trade within the downtrend channel (pink), creating a new low of 0.260 and a lower high today. It also seems that Baker Tech could barely hold on to its 0.270 support (blue --).
We could continue to see BakerTech trade within the downtrend channel next week, with in the increased possibility of it testing the 0.255 support (red --)
For monday :
Support @ 0.270 (blue --), 0.257 (mid pink), 0.255 (red --), 0.251 (low red), 0.248 (low pink)
Resistance @ 0.2757 (upp pink), 0.280 (green --), 0.290 (red ...), 0.293 (upp red)
Friday, July 18, 2008
Indofood Agri Research Report
by CIMB-GK (18 July)
Recent developments suggest that regulatory risks for the sector have increased. This could limit planters' earnings leverage to CPO prices. If CPO prices continue to head higher, governments may levy higher taxes on planters to rein in inflation.
There is also an increasing risk that biofuel targets may be scaled back. Cosc pressures on planters are on the rise as fertiliser prices have more than doubled year-to-date.
We believe that CPO prices will most likely peak in 2008 as the high prices in the past three years have spurred new plantings of oilseeds and curbed demand growth in low-income countries.
We are cutting our EPS estimates by 3% to 8% for FY2008 to FY2010. We are lowering our target forward PER to 15x from 18x, to account for the less rosy outlook.
-Research Report by CIMB-GK (18 July)
Thursday, July 17, 2008
Cosco Research Report
by Citigroup Research (17 July)
Cosco signed a Letter of Intent (LOI) with Sevan to exercise its earlier option to build the second and third Sevan 650 drilling units. Based on the first rig contract value (USD170m or SGD230m), subsequent projects should be worth more than USD200m each, after factoringin higher raw material prices. Currently, a deposit of USD7m is paid for the LOI.
Expanding its work beyond hull fabrication is a key catalyst for the stock, as it demonstrates its technical strength and entrenches its value-add further in the supply chain.
Cosco recently garnered options to build six additional semisubs for Sevan, thus more projects could be in the pipeline. The potential contract value could range from USD 1.6b to USD 4b for eight semisubs (assuming the remaingin six options are converted).
Target price is based on 14 to 15 times FY2009E PE.
-Research Report by Citigroup Research (17 July)
Wednesday, July 16, 2008
Cosco Research Report
by DMG & PARTNERS SECURITIES (16 July)
COSCO Corp had announced that it has signed a Letter of Intent with Sevan Marine (Sevan) to exercise the option attached to the Sevan Driller rig contract awarded in Q107. This option entails the hull construction (Phase 1) as well as assembly and outfitting (Phase 2) of two additional Sevan drilling units, based on Sevan's proprietary Sevan 650 design.
However, we understand that the exact terms of this option contract have not been finalised as Sevan is intending to pursue beyond the option given that is for Cosco to build the entire semi-submersible on a turnkey project basis instead of merely constructing the hull.
What's for Cosco? Phase 1 of the first Sevan drilling unit (Sevan Driller) would be taking approximately 11 months, with expected completion in September 2008. Should Sevan solely award Cosco with the construction of the hull, we note that Cosco would be able to construct it in less than 11 months.
We estimate the contract for each newbuild to be US$200 million (20 per cent more than Sevan Driller). Separately, Cosco would be providing Sevan with six more similar options, which could potentially add US$1.6 billion to Cosco's order book if all options are exercised.
We understand that Sevan is negotiating with Cosco with regard to building the drilling units on a turnkey basis, which may include procuring the drilling package. While turnkey projects are larger in contract value (approximately US$600 million), such projects do involve significantly higher risks with much onus on Cosco.
Key risks to this turnkey project include yard execution risk and competitive delivery dates. We note that Sevan has secured two drilling contracts, a six-year Petrobras contract with start-up by 2012 and a three-year ONGC contract with drilling commencement in early 2011.
We believe the tight delivery deadlines are too stretched for a relatively young yard like Cosco to take on. However, should Cosco agree on the turnkey projects, Cosco would offer Sevan six further options on turnkey basis which could possibly bring Cosco's orderbook to US$4.8 billion when all options are exercised.
-Research Report by DMG & PARTNERS SECURITIES (16 July)
Tuesday, July 15, 2008
Olam 150708
Olam broke the 2.27 support (red ...) today, after trading sideways since the beginning of jul. It also broke the long term downtrend support (mid pink) and 2.20 support level (blue --).
Olam closed right on the downtrend support (mid red) and 2.16 support (green --). Today's breakdown was also accompanied by an increased in volume, which usually doesn't bode well.
Olam could have formed a Head & Shoulders (a broader one) which I've indicated on the chart. Neckline looks to be at the 2.60 level. Since the peak is 3.19 (30 may), which gives us a difference of almost 60 cents. So we could be looking at Olam hitting a low of around 2.00 (2.60 - 0.60) before there could be any chance of a reversal.
Going back to the trendlines, what this means is that we could see Olam weakening further, and testing the 2.04 support (pink --) sooner rather than later. The last time we saw Olam hitting such low prices was in mar.
For tomorrow :
Support @ 2.16 (green --), 2.13 (mid red), 2.10 (low pink, red --), 2.04 (pink --), 2.02 (low red)
Resistance @ 2.20 (blue --), 2.22 (mid pink), 2.27 (red ...), 2.31 (low green), 2.36 (green ...)
Hope you find my analysis helpful. Thank you for your support !!
Cosco 150708
Cosco tested the 3.08 support (red ...) again today, and was also in danger of breaking it and the uptrend support (low blue). Last minute buying up saw it close above the 3.08 support and uptrend support, but only just.
I have a feeling the 3.08 support may not hold out much longer and if the support breaks, we could see Cosco testing the downtrend support (low red), or even the 2.98 support (red --).
For tomorrow :
Support @ 3.10 (low blue), 3.08 (red ...), 3.05, 3.03, 3.01 (low red), 2.98 (red --)
Resistance @ 3.13 (upp pink), 3.15 (mid red), 3.22 (upp blue), 3.26 (blue ...)
Hope you find my analysis helpful. Thank you for your support !!
China HongX 150708
Following the breakout on 11 jul, China Hongxing managed to trade above the 0.480 support (red --), and even tested the uptrend resistance (upp blue).
However, the uptrend was short-lived as we saw China Hongxing breaking the 0.480 support and even closing below the long term downtrend support-turned-resistance (upp grey).
Given the volatile nature of the market recently, I won't be surprised to see China Hongxing opening below the long term downtrend resistance (upp grey) tomorrow. We could still see China Hongxing testing the 0.480 resistance (red --) momentarily tomorrow.
If China Hongxing breaks the uptrend support (low blue), which is very likely, we could see it testing the 0.450 support (blue ...).
For tomorrow :
Support @ 0.4725 (upp grey), 0.465 (low blue), 0.450 (blue ...), 0.440 (low grey, blue --)
Resistance @ 0.480 (red --), 0.495 (mid blue, pink ...), 0.510 (upp blue)
Hope you find my analysis helpful. Thank you for your support !!
BakerTech 150708
After breaking out on 11 jul, Baker Tech went on to test the 0.290 resistance (red ...) the following day and volume for that day hit 10m. BakerTech could not maintain its uptrend momentum and closed right on the 0.270 support (blue --).
With 10m done on 14 jul, you can expect many people to be 'trapped' above the 0.280 level (green --). Looking at the chart, Baker Tech seems to have difficulty breaking out of the downtrend channel (pink).
We could see Baker Tech trading sideways, at best, along the 0.270 level (blue --). And if it doesn't break the 0.280 level (green --) soon, or if BakerTech slips below the 0.270 level, we could see it test the downtrend support (mid pink).
For tomorrow :
Support @ 0.270 (blue --), 0.262 (mid pink), 0.255 (low red, red --), 0.253 (low pink)
Resistance @ 0.280 (upp pink, green --), 0.290 (red ...), 0.295 (upp red)
Hope you find my analysis helpful. Thank you for your support !!
Indofood Agri Research Report
by DMG & Partners (15 July)
SHARE price down on equity fund-raising talk: Rumours of equity placement may have caused Indofood Agri's share price drop. Bisnis Indonesia purportedly reported on Monday that Indofood Agri is currently looking to sell 10-15 per cent of its shares to raise about US$300 million-US$350 million for the repayment of a bridging loan maturing in Q3 2008.
Following the news release, we have spoken to management on Monday and they have maintained that the company is currently in talks with financial institutions to refinance the 2.4 trillion rupiah (about S$372 million) bridging loan maturing in August 2008 and that the negotiations are currently on track.
According to the United States Department of Agriculture's (USDA) projections, global palm oil consumption for 2008/2009 will grow 6 per cent, to reach 42.7 million tonnes. On the back of tight soybean supply (USDA projects a drop in soybean production from June's forecasts - from 3.1 billion to 3 billion bushels - and projects declining yields - from 42.1 bushels an acre in June to 41.6 bushels) and persistently high crude oil prices (currently around US$145 per bbl), crude palm oil (CPO) prices are likely to remain at favourable levels (currently around RM3,500 or S$1,460 per tonne).
With the global trend of higher consumption and usage of palm oil and the present high CPO price of about RM3,500 per tonne, we believe that Indofood Agri will continue to enjoy the present conducive environment, especially with its high ratio of mature acreage.
As such, we are maintaining our fair value a PE of 14 times. This translates into a potential upside of 57.5 per cent.
-Research Report by DMG & Partners (15 July)
Sunday, July 13, 2008
STX Pan Ocean 110708
After closing right on the long term downtrend support (low red) on 4 jul, STX Pan Ocean staged a typical dramatic recovery the next trading day, coming to within touching distance of the 1st downtrend resistance (mid pink) and 2.87 neckline (pink --).
From here, there could be 2 ways STX Pan Ocean may continue - trading sideways, mirroring a pattern similar to the 28 mar to 14 apr period, and then exploding upwards.
For this scenario to happen, STX Pan Ocean would at least have to trade above the 2.75 support (blue ...) next week, and break the 1st downtrend resistance (mid pink). The upside would probably be limited by the 2.87 resistance (pink --). Volume would also have to start picking up.
Or, we could see STX Pan Ocean's trading pattern taking yet another dramatic twist downwards, similar to the pattern from 26 may to 6 jun. This scenario would probably take place if STX Pan Ocean breaks the 2.75 support (blue ...) as well as the uptrend support (low blue).
If STX Pan Ocean breaks the 2.75 support (blue ...), there could still be a possibility for it to trade sideways, between the 2.75 neckline and 2.62 support (red ...). If the 2.62 support breaks too, we could see STX Pan Ocean testing the 2.52 support (red --).
For monday :
Support @ 2.75 (blue ...), 2.65 (low blue), 2.62 (red ...), 2.52 (red --), 2.45 (green --), 2.41 (low pink), 2.38 (blue --), 2.32 (low red), 2.28 (pink ...)
Resistance @ 2.85 (mid pink), 2.87 (pink --), 2.93 (upp blue), 2.95 (green ...), 3.03 (mid red), 3.05 (upp pink)
Hope you find my analysis helpful. Thank you for your support !!
Saturday, July 12, 2008
SGX 110708
After hitting a low of 6.50 on 8 jul, SGX managed to recover and trade above the 6.68 support (red --). SGX also broke, and closed above the downtrend resistance (upp red) and 6.92 resistance (green ...) today.
Are we looking at the start of a reversal for SGX? For that to happen, SGX would at least have to open above the downtrend resistance (upp red) on monday, and ideally trade above the 6.92 support (green ...) too.
If that happens, we could see SGX test the 7.10 resistance (red ...) and even the 1st long term downtrend resistance (mid pink).
But if SGX opens below the downtrend resistance (upp red), then the 6.68 support could be severely tested, or even broken. If that happens, we could see SGX testing the uptrend support (low blue), or even the 6.43 support (green --).
For monday :
Support @ 6.92 (green ...), 6.81 (upp red), 6.68 (red --), 6.51 (low blue), 6.43 (low red, green --)
Resistance @ 7.10 (red ...), 7.16 (upp blue), 7.27 (mid pink), 7.40 (pink --)
Hope you find my analysis helpful. Thank you for your support !!
Semb Marine 110708
Sembcorp Marine has been on the rise since feb, and has now formed a Head & Shoulders formation, with peaks on 21 apr, 2 jun and 8 jul. Sembcorp Marine is now trading around the 1st neckline of 4.22 (red --).
If Sembcorp Marine breaks the 4.22 neckline (red --), we could see it retreating to the 2nd neckline of 4.12 (green --). And if that neckline breaks as well, we could see Sembcorp Marine retreating all the way to the 3.86 support (green ...).
However, if Sembcorp Marine maintains trading above the 4.22 neckline, we could see it consolidating for a period before attempting to break the 4.30 resistance (blue --). And if that happens, we could see Sembcorp Marine hitting the highs of 2 jun.
For monday :
Support @ 4.22 (blue --), 4.18 (mid blue), 4.14 (low red), 4.12 (green --), 4.02 (low pink)
Resistance @ 4.29 (mid pink, upp red), 4.30 (blue --), 4.40 (pink ...), 4.43 (upp blue)
Olam 110708
Ever since Olam broke the 2.48 support (blue ...) on 27 jun, it has been more or less trading sideways around the 2.36 support (green ...), testing the 2.27 support (red ...) once on 3 jul.
As you can see from the chart, Olam is still trading withing the long term downtrend channel (pink). The sideways trading could be a consolidation phase for Olam. It would have to trade above the 2.36 neckline (green ...) before we can have any chance of a reversal.
However, if Olam breaks the uptrend support (low green) and the 2.27 support (red ...), we could see Olam testing the long term downtrend support (low pink), or even the 2.10 support (red --).
For monday :
Support @ 2.36 (green ...), 2.295 (low green), 2.27 (red ...), 2.236 (mid red), 2.23 (low pink), 2.20 (blue --)
Resistance @ 2.41 (mid pink), 2.43 (upp red), 2.48 (blue ...), 2.553 (upp green)
Hope you find my analysis helpful. Thank you for your support !!
Ferro China 110708
After hitting a low of 1.05 on 4 jul, FerroChina managed to recover and even trade above the 1.11 resistance (red --). Trading this week was more or less range bound between the 1.11 support and 1.18 resistance (light blue --).
We could see some action next week as the downtrend resistance (upp red) meets the uptrend support (low blue) at abt the 1.16 level.
If Ferro China trades above the 1.16 level, we could see it continue its uptrend and test the 1st long term downtrend resistance (mid pink), or even the 1.22 resistance (blue --).
However, if FerroChina breaks the uptrend support (low blue), we would most likely see it revisiting the 1.11 support (red --).
For monday :
Support @ 1.15 (low blue), 1.11 (red --), 1.057 (low red), 1.05 (red ...), 1.02 (low pink)
Resistance @ 1.17 (upp red), 1.18 (light blue --), 1.19 (mid pink), 1.22 (upp blue, blue --)
Hope you find my analysis helpful. Thank you for your support !!
Cosco 110708
Although Cosco is trading above (barely) the long term downtrend resistance (upp pink), it is still not out of the woods yet, as it again tested the 3.08 support on 10 jul. It is also trading below the mid term downtrend resistance (mid red).
Recent average daily volume has also dropped, sometimes even below the 10m mark. We may have to see an increase in daily average volume first before there's any chance of Cosco picking up again. That's provided it doesn't break the 3.08 support (red ...).
For monday :
Support @ 3.09 (low blue), 3.08 (red ...), 3.06 (upp pink), 2.98 (red --)
Resistance @ 3.17 (mid red), 3.22 (upp blue), 3.26 (blue ...), 3.33, 3.36 (green ...)
Hope you find my analysis helpful. Thank you for your support !!
China HongX 110708
After hitting a low of 0.420 on 4 jul, China Hongxing traded mostly sideways this week, until today. China Hongxing broke the 1st long term downtrend resistance (low grey), and also the 0.480 resistance (red --).
China Hongxing also tested the 2nd long term downtrend resistance (upp grey) and 0.495 neckline (pink ...), before closing right on the long term downtrend resistance (upp grey).
Having been on the downtrend since the beginning of may, we could be seeing the start of a trend reversal for China Hongxing.
However, whether the reversal would materialise would have to depend if China Hongxing can maintain its uptrend momentum by continuing to trade within the uptrend channel (blue). Of course, its chances would greatly increase if it could also trade above the 0.480 neckline (red --).
For monday :
Support @ 0.485 (upp grey), 0.480 (mid blue, red --), 0.450 (low blue, low grey, blue ...), 0.440 (blue --), 0.425 (green --)
Resistance @ 0.495 (pink ...), 0.500 (upp blue), 0.520 (pink --), 0.535 (light blue --)
Hope you find my analysis helpful. Thank you for your support !!
BakerTech 110708
After being on the downtrend for about a month, BakerTech finally broke through a few resistances. However, it is still some way off the 0.340 high it hit on 7 may, and there are still a few big hurdles to clear along the way.
If Baker Tech manages to trade at least above the 0.270 level (blue --), we could see it slowly reversing its downtrend.
However, if BakerTech trades below the 0.270 level, it could indicate that today was a false break.
For monday :
Support @ 0.283 (upp pink), 0.280 (green --), 0.270 (blue --), 0.256 (low pink, low red), 0.255 (red --)
Resistance @ 0.290 (red ...), 0.298 (upp red), 0.300 (blue ...), 0.305 (pink ...)
Hope you find my analysis helpful. Thank you for your support !!
Wednesday, July 9, 2008
Semb Marine Research Report
by CIMB-GK (8 July)
SEMBCORP Marine (SembMarine) announced that Houston-based Atwood Oceanics has exercised an option to build a deepwater semi-submersible rig at US$565 million.
The contract comes with a non-fixed price option (expiring end-2008) for a third unit. The semi-sub rig will be delivered in mid-2012 and does not include certain owner-furnished equipment and owner-related costs.
The current contract value is double that of the first rig ordered by Atwood in January 2008 worth US$280.5 million, for 2011 delivery. The higher value stems from the second rig's more sophisticated specifications for its dynamic positioning system to facilitate operations in harsher environments and deeper water depths of 10,000 feet. The first unit will be built on a conventional mooring system operable at only 8,000 feet.
A week into July, SembMarine has already secured contracts worth US$1.6 billion (about S$2.2 billion), boosting its YTD orders to S$4 billion. It is fast catching up with Keppel Offshore & Marine's order momentum. The second rig order from Atwood supports our belief that prospects for deepwater drilling remain strong.
SembMarine remains our top pick in the offshore & marine sector for its pure exposure and successful order-book expansion. We believe y-o-y margin expansion could be a key catalyst for the stock.
-Research Report by CIMB-GK (8 July)
Sunday, July 6, 2008
STX Pan Ocean 040708
After forming a multiple top (4 tops) from end apr to early jun, STX Pan Ocean finally broke the 2.95 neckline (green ...) on 13 jun. STX Pan Ocean then traded sideways along the 2.75 level (blue ...) before taking a dive again on 1 jul.
STX Pan Ocean tested 2 downtrend supports (low pink, low red) before closing right on the long term downtrend support (low red).
If STX Pan Ocean breaks the long term downtrend support (low red), the next support, based on volume distribution, would be around the 2.28 level (pink ...). And if that breaks as well, we could see STX Pan Ocean hitting the 22 jan low of 2.09 soon.
For monday :
Support @ 2.32 (low red), 2.28 (low pink, pink ...), 2.17, 2.09
Resistance @ 2.38 (blue --), 2.45 (green --), 2.52 (mid pink), 2.62 (low blue, red ...), 2.75 (blue ...)
Hope you find my analysis helpful. Thank you for your support !!
SPC 040708
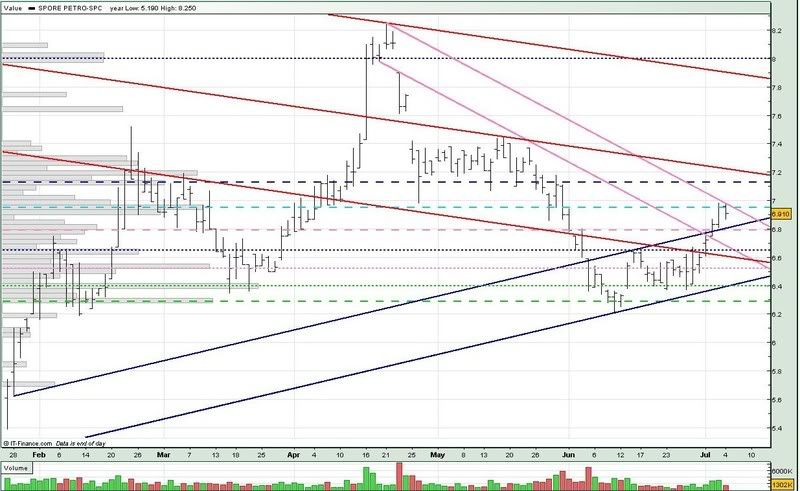
After completing the double-bottom formation in jun, SPC broke the 1st neckline of 6.65 (blue ...) on 1 jul, and then the 2nd neckline of 6.79 (pink --) on 2 jul.
SPC now seems to have hit resistance at the 3rd neckline of 6.95 (light blue --). We could see some profit taking for SPC next week, with SPC trading between the 6.95 neckline (light blue --) and 6.79 support (pink --).
For monday :
Support @ 6.81 (low blue), 6.79 (pink --), 6.66 (low pink), 6.65 (blue ...), 6.60 (low red)
Resistance @ 6.95 (upp pink, light blue --), 7.13 (blue --), 7.21 (mid red)
Hope you find my analysis helpful. Thank you for your support !!
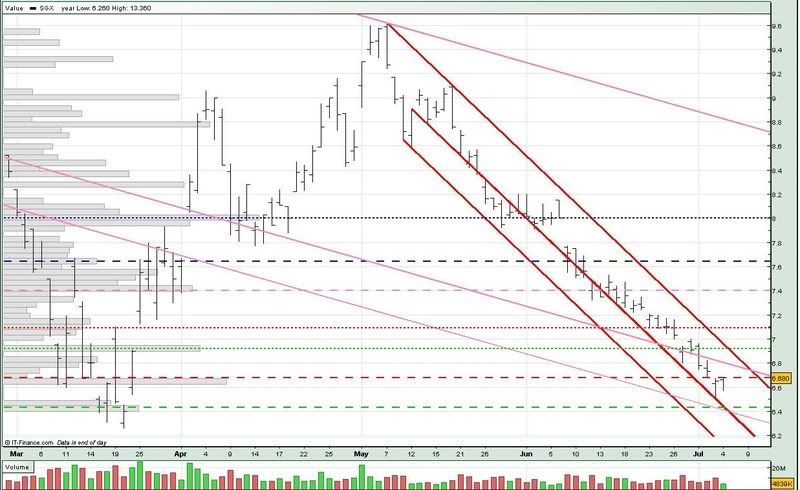
SGX 040708
Since our last visit on 13 Jun, SGX continued to trade within the downtrend channel (red), and has broken quite a few supports along the way.
SGX is now trading below the 6.68 neckline (red --) and also the long term downtrend resistance (mid pink).
We would probably see SGX trading between the 6.68 resistance (red --) and 6.43 support (green --) next week.
For monday :
Support @ 6.43 (green --), 6.40 (low pink, mid red)
Resistance @ 6.68 (red --), 6.78 (mid pink), 6.90 (upp red), 6.92 (green ...)7.09 (red ...)
Hope you find my analysis helpful. Thank you for your support !!
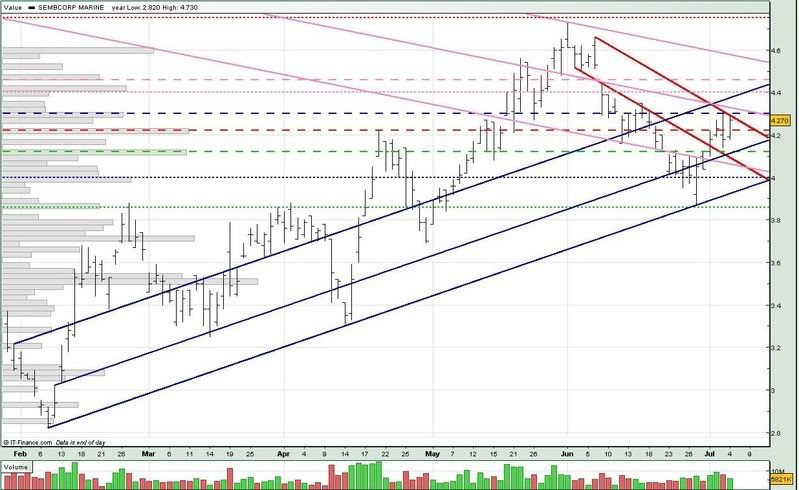
Semb Marine 040708
What a week it has been for Sembcorp Marine. After almost testing the 3.86 support (green ...) on 27 jun, Sembcorp Maring totally reversed its downtrend and recovered to test the 4.30 resistance (blue --).
We may see some profit taking for Sembcorp Marine this week, with trading probably going sideways around the 4.22 level (red --), and possibly testing the 4.12 support (green --).
If Sembcorp Marine stays above the 4.22 support (red --), we might see it testing the 4.30 resistance (blue --) soon, or even breaking it.
For monday :
Support @ 4.22 (red --), 4.12 (mid blue, green --), 4.07 (low red), 4.055 (low pink), 4.00 (blue ...)
Resistance @ 4.276 (upp red), 4.30 (blue --), 4.32 (mid pink), 4.38 (upp blue), 4.40 (pink ...)
Hope you find my analysis helpful. Thank you for your support !!
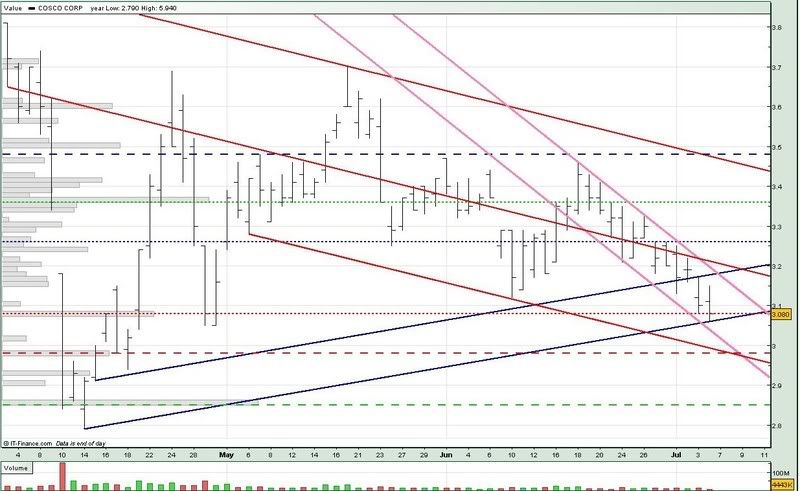
Cosco 040708
It is the 2nd time this week that Cosco tested the 3.08 support (red ...) while continuing to trade within the downtrend channel (pink).
There is a possibilty that Cosco might trade sideways next week, supported by the 3.08 level (red ...) and limited on the upside by the downtrend resistance (upp pink).
We could see some action by the end of next week when the uptrend support (low blue) meets the downtrend resistance (upp pink) at around the 3.08 support level.
For monday :
Support @ 3.08 (red ...), 3.06 (low blue), 3.01 (low pink), 2.98 (low red, red --)
Resistance @ 3.17 (upp pink), 3.18 (upp blue), 3.20 (mid red), 3.26 (blue ...)
Hope you find my analysis helpful. Thank you for your support !!
Saturday, July 5, 2008
Ferro China Research Report
by DMG & Partners (4 July)
JUST about a week or two ago, news was released about the finalisation of iron ore price discussions between Australian miners and Chinese steel mills. Brazilian miners had earlier this year set a 65-71 per cent increase in iron ore prices with Chinese steel mills, which were ignored by the Australian miners, arguing that their proximity to China reduced iron ore shipping costs.
That said, inflation fears among Chinese steelmakers appear to have deepened after they agreed to pay Anglo-Australian miner Rio Tinto up to 96.5 per cent more for their iron ore supplies this year.
This represents the largest ever annual increase and well above the 9.5 per cent increase paid last year. Baosteel then followed by releasing a statement saying that the deal would maintain pricing stability and encourage Rio Tinto's efforts to expand investments and increase production to ensure steady supply.
Such a highly priced new contract for iron ore will likely boost the cost of cars, machinery and other steel-related products.
Margins for giant steelmakers will definitely be maintained or perhaps even expand due to their ability to control prices and pass costs on to their ultimate customers, such as construction companies and car makers. Ferrochina, using hot-rolled steel coils as its raw material input, would appear to get squeezed as well.
However, according to the management, this is how the company has rectified the situation:
The news of the possibility of a 96.5 per cent increase in iron ore supplies from Australia had been floating around for a while, and hence already discounted into prevailing prices in the Chinese market, reducing any shocks.
Throughout the course of its business, Ferrochina has been successfully able to pass on the bulk of any raw material price increases to its customers as it is viewed as a steel processor. The passing on of costs, however, have a lagged effect, as its sales-order cycle is about four months. The selling price of a product is determined at the point of order, using a feedstock price plus a processing fee as its pricing formula. Almost all its products manufactured are backed with a matching order.
Management of Ferrochina has always seen rising steel prices as a threat, and hence started to expand its product offerings a while back, offering a wider range of thickness of galvanised steel gauges and different finishes of galvanising methods.
Management has also improved production efficiency through quicker maintenance works and increased the cold-rolling speeds to help raise utilisation.
We maintain our blended PE of 9; we view the current market weakness as an opportunity to start accumulation.
-Research Report by DMG & Partners (4 July)
China HongX 040708
There was indeed action for China Hongxing today. Initially, China Hongxing was moving towards testing the downtrend resistance (upp pink). However, selling pressure soon took over and we saw China Hongxing breaking the uptrend support (low blue).
After lunch, even more selling pressure pushed China Hongxing lower and it broke the 0.425 support (green --), before recovering towards the end of the day to close right on the 0.425 support.
China Hongxing has now been on the downtrend since the beginning of May. And if China Hongxing fails to close above the 0.425 support (green --) next week, we could see it test the long term downtrend support (low grey).
For monday :
Support @ 0.425 (green --), 0.405 (20 mar low), 0.390 ((low grey, low pink)
Resistance @ 0.435 (low blue), 0.440 (upp pink, blue --), 0.450 (blue ...), 0.460 (upp blue), 0.480 (red --)
Hope you find my analysis helpful. Thank you for your support !!
BakerTech 040708
BakerTech seems to have found temporary support at the 0.255 level (red --), but it is still trading within the downtrend channel (pink), like it did in mid feb to mid mar.
If the 0.255 support (red --) breaks, Baker Tech would most likely hit the 2008 low of 0.240.
For monday :
Support @ 0.255 (low blue, red --), 0.250 (low pink), 0.240
Resistance @ 0.262 (mid red), 0.270 (upp blue, blue --), 0.272 (upp pink), 0.275 (pink --)
Hope you find my analysis helpful. Thank you for your support !!
Thursday, July 3, 2008
Ferro China 030708
After testing the 1.11 support (red --) yesterday, Ferro China finally broke it and even closed right on the downtrend support (low red) today.
The chance of FerroChina hitting the 2008 low of 1.01 has increased, and it will increase even further if Ferro China breaks the 1.05 support (red ...). Looking at the way things are going, it's just a matter of time.
For tomorrow :
Support @ 1.09 (low blue), 1.07 (low red), 1.06 (low pink), 1.05 (red ...), 1.01
Resistance @1.11 (red --), 1.13 (mid red), 1.15 (mid pink), 1.18 (upp blue, light blue --), 1.22 (blue --)
Hope you find my analysis helpful. Thank you for your support !!
Cosco 030708
Cosco continued trading within the downtrend channel (pink), breaking the downtrend support (mid red), and testing the 3.08 support (red ...).
If Cosco breaks the 3.08 support (red ...), we could see it heading for the 2.98 support (red --), which is also where the 2 downtrend supports (low pink, low red) meet.
For tomorrow :
Support @ 3.08 (low blue, red ...), 3.03 (low pink), 2.99 (low red), 2.98 (red --)
Resistance @ 3.112 (mid red), 3.197 (upp pink), 3.214 (upp blue), 3.26 (blue ...)
Hope you find my analysis helpful. Thank you for your support !!
China HongX 030708
The Abandoned Baby or Morning Doji Star did not materialise after China Hongxing had formed the Long Legged Doji on 27 jun. Instead, we saw China Hongxing trading sideways, supported by the uptrend support (low blue) and limited by the downtrend resistance (upp pink).
You can see from the chart that the general sentiment of the market is still very weak as China Hongxing always closes below the downtrend resistance (upp pink).
We could see some action tomorrow as the downtrend (upp pink) meets the uptrend support (low blue) at around the 0.435 level. If that breaks, we could see China Hongx revisiting the year low of 0.405 it hit on 20 mar, which is about the level indicated by the long term downtrend support (low grey).
For tomorrow :
Support @ 0.4355 (upp pink, low blue), 0.395 (low grey), 0.385 (low pink)
Resistance @ 0.4605 (mid blue), 0.480 (red --), 0.515 (upp blue), 0.520 (upp grey, pink --)
Hope you find my analysis helpful. Thank you for your support !!
Olam Research Report
by CIMB-GK Research (2 July)
ANOTHER joint venture with Wilmar to enter sweetener market: Olam has announced another 50:50 joint venture (JV) with Wilmar International, Olam Wilmar Investment Holdings (OWIH), which will be used to acquire a 20 per cent stake in PureCircle (listed on London's Alternative Investment Market or AIM), a producer of zero-calorie natural high-intensity sweetener Rebaudioside-A, an extract from the stevia plant, for US$106.2 million.
The JV will also be invited to have a representative on PureCircle's board of directors. In addition, OWIH and PureCircle have signed a memorandum of understanding to form a strategic partnership to develop and manage commercial stevia plantations in existing and new locations, assist in developing efficient commercial scale crude extraction facilities, and leverage on Wilmar and Olam's wide distribution network to accelerate PureCircle's sales growth.
The purchase price translates into £2.01 (S$5.44) per share, a 0.5 per cent premium over the June 30 traded price of £2. At £2.01, the shares are valued at an FY2007 historical PE of 115, and consensus estimated FY2008 PE of 22.4 and FY2009 PE of four. Based on consensus estimates for PureCircle, the net profit contribution to Olam is expected to be about US$7.75 million in FY2009 (June year-end).
PureCircle, which listed on AIM in December 2007 at £1.70, has a 95 per cent stake in China-based Ghanzhou Julong High Tech Food Industries, which has the necessary plantations and extraction facilities to allow PureCircle to cultivate at least 5,000 tonnes of high-purity stevia plants. In addition, PureCircle has a refining facility in Malaysia.
One of the key reasons for the investment is the potential development of stevia plantations in Africa and South America, where Olam and Wilmar, through their other JV, Nauvu Investments, have local market insight and experience in managing risks. Olam's management also thinks that the sweetener products complement Olam's existing agricultural-based product portfolio, with overlapping F&B-manufacturing customers.
The acquisition is in line with the company's stated intention of expanding upstream and expansion into complementary products. The profit contribution of around S$10.5 million in FY2009 accounts for 5.4 per cent of our current FY2009 net profit estimates, and 22 per cent of the profit growth that we have factored into our assumptions for FY2009. Our EPS estimates, recommendation and target price are under review after the transition of coverage.
-Research Report by CIMB-GK Research (2 July)
Tuesday, July 1, 2008
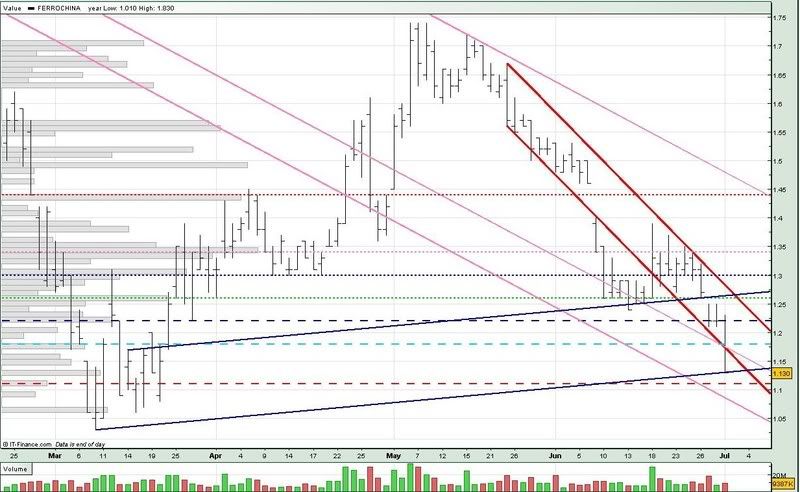
Ferro China 010708
Ferro China not only broke the 1.18 support (light blue --), it also broke the long term downtrend support (mid pink). FerroChina is now even more dire than before as it is trading closer and closer to the 1.11 support (red --).
If Ferro China breaks the 1.11 support, as well as the next long term downtrend support (low pink), we could see it testing 1.01 again, which is the low for 2008.
For tomorrow :
Support @ 1.11 (red --), 1.077 (low pink), 1.01
Resistance @ 1.16 (low red), 1.17 (low pink), 1.18 (light blue --), 1.22 (blue --), 1.26 (upp blue, green ...)
Hope you find my analysis helpful. Thank you for your support !!
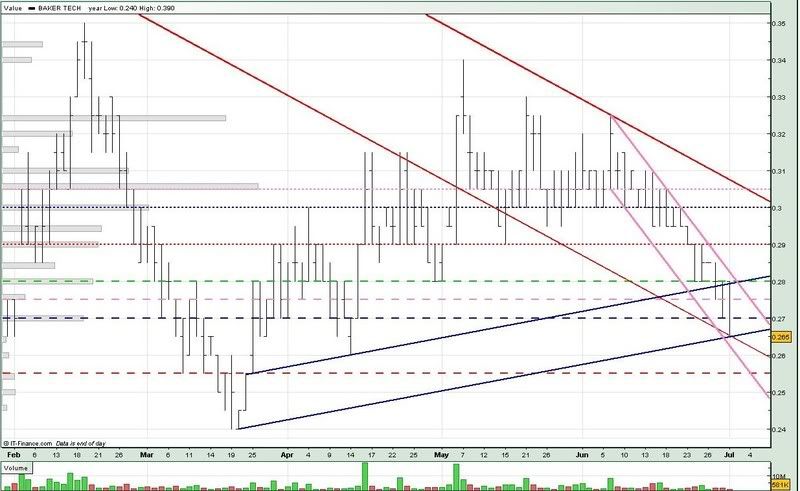
BakerTech 010708
We finally saw Baker Tech break the 0.280 support on 30 jul, and BakerTech also tested and closed right on the long term downtrend support(low red). We could be seeing a repeat of the protracted downtrend which started in the middle of feb till middle of mar.
Right now, the next significant support for Baker Tech, based on volume, could be at the 0.255 level (red --). If that also breaks, we would most likely see BakerTech testing the 0.240 low again.
For tomorrow :
Support @ 0.264 (low red), 0.260 (low pink), 0.255 (red --)
Resistance @ 0.270 (blue --), 0.275 (pink --), 0.280 (upp blue, upp pink, green --), 0.290 (red ...)
Hope you find my analysis helpful. Thank you for your support !!
Subscribe to:
Posts (Atom)