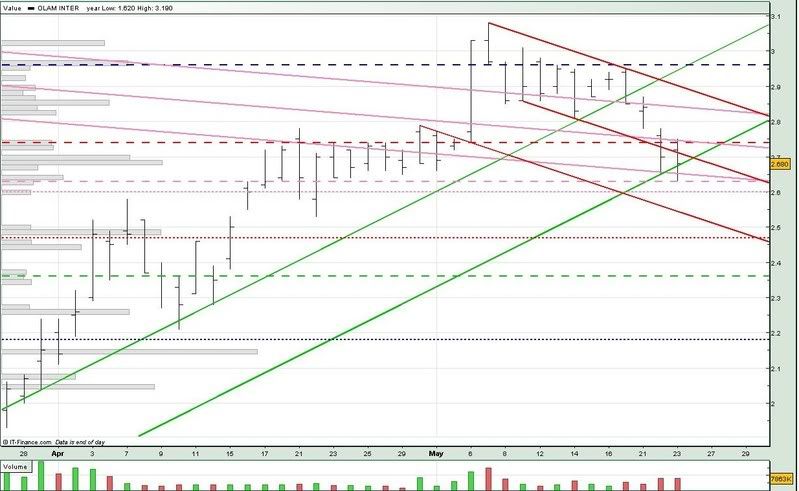
From the chart, we can see some support around the 2.67 - 2.68 level. We also see that the uptrend support (low green) meets the downtrend resistance (mid red) at the 2.70 level on the next trading day (monday 26 may).
If Olam opens below that 2.70 level, we might see it trading between the downtrend resistance (mid red) and the 2.60 support (pink ...).
If Olam manages to Olam above the 2.70 level, there's a chance it might test the 2.74 resistance (red --),
For monday :
Support @ 2.647 (low pink), 2.63 (pink --), 2.60 (pink ...), 2.53 (low red)
Resistance @ 2.70 (low green, mid red), 2.74 (mid pink, red --), 2.83 (upp pink), 2.89 (upp red)
Good Luck !!


No comments:
Post a Comment