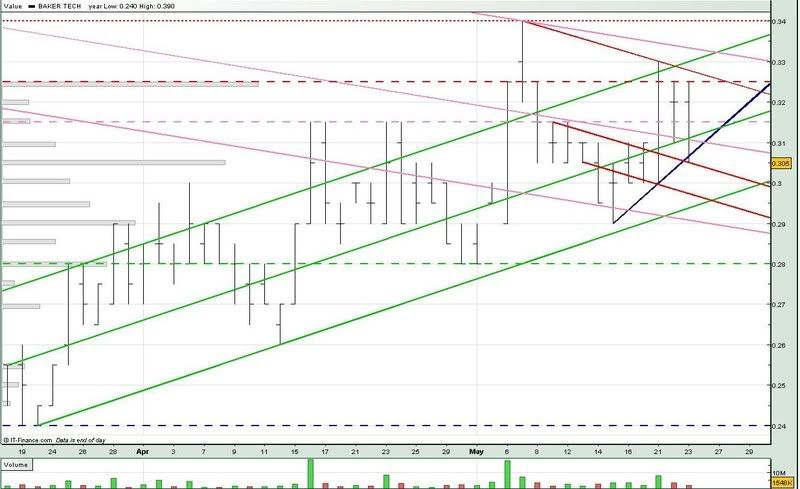
Would we see BakerTech trading sideways, like during the 15 - 29 apr period? Or soften further, similar to the 6 - 15 may period?
We would have to see where Baker Tech opens on monday. If it opens below the long term downtrend resistance (mid pink) and breaks the downtrend support (mid red), we most likely would see BakerTech softening further.
If Baker Tech opens and stays above the uptrend resistance (mid green), we might see it trading sideways around the 0.310 level.
For monday :
Support @ 0.304 (mid red), 0.296 (low red), 0.295 (low green), 0.290 (low pink)
Resistance @ 0.310 (blue, mid pink), 0.312 (mid green), 0.315 (pink --), 0.325 (red --)
Good Luck !!


No comments:
Post a Comment