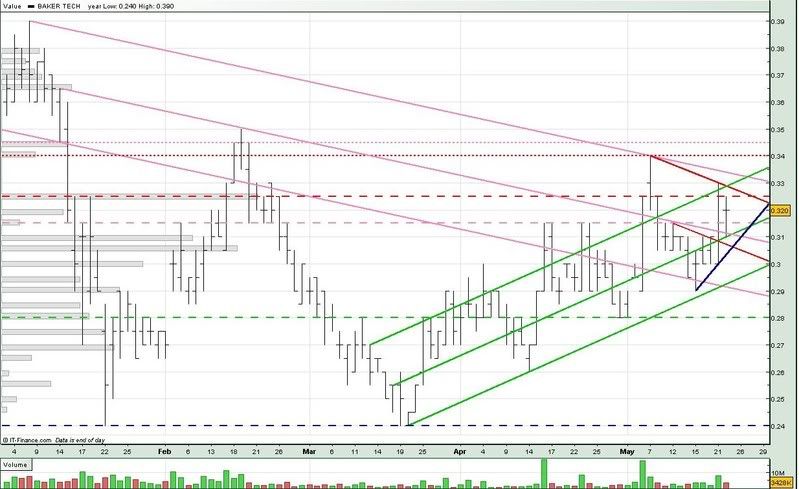
Today, we saw BakerTech testing the 0.325 neckline again, as well as the uptrend support (mid green), before closing to form a Harami Cross, which typically indicates a trend reversal.
Since today is only the second day after the breakout yesterday, we would need wait for confirmation of a trend reversal tomorrow. This confirmation may be in the form of a black candlestick, a large gap down or a lower close on the third day.
If you look at the previous breakouts, Baker Tech usually trades sideways after the second or third day from its breakout, forming Harami Crosses along the way.
If we look at the volume distribution, the 0.325 neckline still looks quite a formidable block for BakerTech to overcome. If Baker Tech trades sideways, we might see it consolidating around the 0.305 to 0.310 region, based on volume distribution.
For tomorrow :
Support @ 0.315 (pink --), 0.311 (mid green, mid pink), 0.306 (low red, blue), 0.305
Resistance @ 0.325 (red --), 0.328 (upp red), 0.330 (upp green), 0.333 (upp pink), 0.340 (red ...)
Good Luck !!


No comments:
Post a Comment