by CIMB-GK RESEARCH (18 Nov)
THE Q3 2008 earnings season has just concluded. Despite marked-down expectations by our analysts, the number of companies with earnings misses still outnumbered those that sprang positive surprises by 2:1.
Sectors that disappointed this quarter were banks, transport, telcos, manufacturing and S-chips. Sectors that beat expectations were plantations and offshore and marine. In the past three months, we had pulled down our expectations for Straits Times Index (STI) EPS growth.
We now expect STI earnings to contract 6.3 per cent y-o-y in 2008 and 13.7 per cent y-o-y in 2009. The bulk of our earnings cut came in October/November - we chopped our estimates for STI 2008 EPS by 8 per cent and 2009 EPS by 27 per cent in that period. Whether these expectations are low enough remains to be seen. STI earnings fell on average 28 per cent in 1997/98, 2001 and 2003.
Few places to hide in a global recession: In the past three months, the MSCI Singapore Free Index fell 39 per cent. In Singapore, the banking, property, real estate investment trust (Reit), multi-industry, plantations, transport and manufacturing sectors underperformed the index.
The two worst-hit sectors were plantations and transport, as commodity prices went into free fall and the shipping sector suddenly saw demand evaporate, largely from the developed world. Only telcos, media and services outperformed the index.
Our top picks: As the STI attempts to find its floor in the next six to nine months, stocks that we like are either stable, cash businesses that provide decent yields despite recessions or stocks that will emerge from this recession for the better, benefiting from a strong balance sheet now or in a position to emerge as leaders in their industries. The opportunity to pick these stocks at marked-down valuations is their key attraction.
In the former category, the stocks include MobileOne (M1), Singapore Post, ComfortDelGro, Cerebos Pacific, Parkway Life Reit, Sembcorp Marine, Singapore Press Holdings and SP Ausnet. In the latter category, our favoured stocks are Parkway Holdings, CapitaCommercial Trust, Wheelock Properties, City Developments, Venture Corp, Singapore Exchange and Wilmar.
For the next six months, our preferred sectors are media, S-Reits and telcos. The sectors we are wary of are banks, property, transport and consumer discretionary.
We view recent rallies as relief rallies from oversold positions. As the market grapples with the realities of a recession, we expect the STI to lose ground and find a floor anywhere between 1,200 and 1,600 - recession P/B levels.
As companies streamline their cost structures and as governments pump-prime in zest and cut interest rates to near zero in the coming months, we expect the seeds to be sown for an eventual recovery from H2 2009. By our estimation of the typical duration of a recession, a market bottom in mid-2009 seems likely. Our end-2009 STI target is set at 2,040, based on a bottom-up methodology.
-Research Report by CIMB-GK RESEARCH (18 Nov)
Showing posts with label SGX. Show all posts
Showing posts with label SGX. Show all posts
Wednesday, November 19, 2008

Tuesday, October 14, 2008
SGX Research Report
by Citi Investment Research (10 Oct)
Q1FY09 preview: Volatility has kept volumes ahead of forecast in Q1FY09 (September 2008 quarter), and hence the SGX could turn in a flat q-o-q profit of $91 million (Q4FY08: $91 million).
However a sharp fall in the Straits Times Index (STI), changes affecting CNX Nifty futures, and lower structured warrants suggest a weaker revenue outlook. STI's Oct 10 close at 1,948 suggests $920 million per day (our base-case forecast) at a 55 per cent velocity; that velocity may weaken if the STI falls further.
We maintain our FY09 profit forecast of $246 million pending the Q1 results announcement on Oct 15.
Bloomberg consensus expects FY09 net profit of $355 million, and EPS of $0.33. Citi's estimate is at 69 per cent of consensus, and remains at the bottom of the range.
-Research Report by Citi Investment Research (10 Oct)
Q1FY09 preview: Volatility has kept volumes ahead of forecast in Q1FY09 (September 2008 quarter), and hence the SGX could turn in a flat q-o-q profit of $91 million (Q4FY08: $91 million).
However a sharp fall in the Straits Times Index (STI), changes affecting CNX Nifty futures, and lower structured warrants suggest a weaker revenue outlook. STI's Oct 10 close at 1,948 suggests $920 million per day (our base-case forecast) at a 55 per cent velocity; that velocity may weaken if the STI falls further.
We maintain our FY09 profit forecast of $246 million pending the Q1 results announcement on Oct 15.
Bloomberg consensus expects FY09 net profit of $355 million, and EPS of $0.33. Citi's estimate is at 69 per cent of consensus, and remains at the bottom of the range.
-Research Report by Citi Investment Research (10 Oct)
Sunday, July 20, 2008
SGX 180708
SGX continues to trade within the downtrend channel (red), and has also tested the 6.62 support (red --) 3 times this week. If the 6.62 support is broken, we could see SGX testing the 6.43 support (green --).

For monday :
Support @ 6.62 (red --), 6.52 (low blue), 6.43 (low pink, green --), 6.40 (mid red), 6.27 (low red)
Resistance @ 6.74 (upp red), 6.80 (upp blue), 6.92 (green ...), 6.97 (mid pink), 7.09 (red ...)

For monday :
Support @ 6.62 (red --), 6.52 (low blue), 6.43 (low pink, green --), 6.40 (mid red), 6.27 (low red)
Resistance @ 6.74 (upp red), 6.80 (upp blue), 6.92 (green ...), 6.97 (mid pink), 7.09 (red ...)
Saturday, July 12, 2008
SGX 110708
After hitting a low of 6.50 on 8 jul, SGX managed to recover and trade above the 6.68 support (red --). SGX also broke, and closed above the downtrend resistance (upp red) and 6.92 resistance (green ...) today.
Are we looking at the start of a reversal for SGX? For that to happen, SGX would at least have to open above the downtrend resistance (upp red) on monday, and ideally trade above the 6.92 support (green ...) too.
If that happens, we could see SGX test the 7.10 resistance (red ...) and even the 1st long term downtrend resistance (mid pink).
But if SGX opens below the downtrend resistance (upp red), then the 6.68 support could be severely tested, or even broken. If that happens, we could see SGX testing the uptrend support (low blue), or even the 6.43 support (green --).

For monday :
Support @ 6.92 (green ...), 6.81 (upp red), 6.68 (red --), 6.51 (low blue), 6.43 (low red, green --)
Resistance @ 7.10 (red ...), 7.16 (upp blue), 7.27 (mid pink), 7.40 (pink --)
Hope you find my analysis helpful. Thank you for your support !!
Are we looking at the start of a reversal for SGX? For that to happen, SGX would at least have to open above the downtrend resistance (upp red) on monday, and ideally trade above the 6.92 support (green ...) too.
If that happens, we could see SGX test the 7.10 resistance (red ...) and even the 1st long term downtrend resistance (mid pink).
But if SGX opens below the downtrend resistance (upp red), then the 6.68 support could be severely tested, or even broken. If that happens, we could see SGX testing the uptrend support (low blue), or even the 6.43 support (green --).

For monday :
Support @ 6.92 (green ...), 6.81 (upp red), 6.68 (red --), 6.51 (low blue), 6.43 (low red, green --)
Resistance @ 7.10 (red ...), 7.16 (upp blue), 7.27 (mid pink), 7.40 (pink --)
Hope you find my analysis helpful. Thank you for your support !!
Sunday, July 6, 2008
SGX 040708
Since our last visit on 13 Jun, SGX continued to trade within the downtrend channel (red), and has broken quite a few supports along the way.
SGX is now trading below the 6.68 neckline (red --) and also the long term downtrend resistance (mid pink).
We would probably see SGX trading between the 6.68 resistance (red --) and 6.43 support (green --) next week.

For monday :
Support @ 6.43 (green --), 6.40 (low pink, mid red)
Resistance @ 6.68 (red --), 6.78 (mid pink), 6.90 (upp red), 6.92 (green ...)7.09 (red ...)
Hope you find my analysis helpful. Thank you for your support !!
SGX is now trading below the 6.68 neckline (red --) and also the long term downtrend resistance (mid pink).
We would probably see SGX trading between the 6.68 resistance (red --) and 6.43 support (green --) next week.

For monday :
Support @ 6.43 (green --), 6.40 (low pink, mid red)
Resistance @ 6.68 (red --), 6.78 (mid pink), 6.90 (upp red), 6.92 (green ...)7.09 (red ...)
Hope you find my analysis helpful. Thank you for your support !!
Wednesday, June 18, 2008
SGX Research Report
by DMG & PARTNERS (17 June)
AVERAGE Daily Turnover (ADT) has fallen from the peak of S$3.03 billion in October 2007 to S$1.80 billion in May 2008 and S$1.54 billion for the first two weeks of June 2008.
The ADT reduction can be partly attributed to investors' increasing concern on growth in the light of surging inflation from higher commodity prices.
We also noted that the average value per share traded has been rising over the past few months. From a low of S$0.67 in June/July 2007, it has steadily risen to S$1.31 in the first two weeks of June 2008. This reflects an increased trading share coming from the blue-chips and a lower share from penny stocks. It could suggest that retail trading interest has been weakening (retailers typically trade the lower value penny stocks).
We have lowered our forecast FY2008 ADT (including structured warrants trading) from S$2.36 billion to S$2.24 billion to take into account the recent weakness in stockmarket turnover.
Our forecast FY2009 ADT has also been lowered from S$2.05 billion to S$1.90 billion. Correspondingly, we have reduced our forecast FY2008 net profit by 5.3 per cent from S$477.3 million to S$451.9 million. Our forecast FY2009 net profit is also cut by 5.9 per cent from S$392 million to S$369 million.
Our fair price is pegged to FY 2009 EPS of 18. We used a multiple of 18, which is a slight premium to the multiple of 16 that SGX traded in FY 2005, when securities market turnover fell 15 per cent y-o-y - our assumption is that FY2009 securities ADT will fall 15 per cent y-o-y to S$1.90 billion.
-Research Report by DMG & PARTNERS (17 June)
AVERAGE Daily Turnover (ADT) has fallen from the peak of S$3.03 billion in October 2007 to S$1.80 billion in May 2008 and S$1.54 billion for the first two weeks of June 2008.
The ADT reduction can be partly attributed to investors' increasing concern on growth in the light of surging inflation from higher commodity prices.
We also noted that the average value per share traded has been rising over the past few months. From a low of S$0.67 in June/July 2007, it has steadily risen to S$1.31 in the first two weeks of June 2008. This reflects an increased trading share coming from the blue-chips and a lower share from penny stocks. It could suggest that retail trading interest has been weakening (retailers typically trade the lower value penny stocks).
We have lowered our forecast FY2008 ADT (including structured warrants trading) from S$2.36 billion to S$2.24 billion to take into account the recent weakness in stockmarket turnover.
Our forecast FY2009 ADT has also been lowered from S$2.05 billion to S$1.90 billion. Correspondingly, we have reduced our forecast FY2008 net profit by 5.3 per cent from S$477.3 million to S$451.9 million. Our forecast FY2009 net profit is also cut by 5.9 per cent from S$392 million to S$369 million.
Our fair price is pegged to FY 2009 EPS of 18. We used a multiple of 18, which is a slight premium to the multiple of 16 that SGX traded in FY 2005, when securities market turnover fell 15 per cent y-o-y - our assumption is that FY2009 securities ADT will fall 15 per cent y-o-y to S$1.90 billion.
-Research Report by DMG & PARTNERS (17 June)
Sunday, June 15, 2008
SGX 130608
SGX continued to weaken further after breaking the 7.40 support (pink --). However, it has managed to stay above the long term downtrend support (mid red), and uptrend support (low blue).
SGX looks to have formed a double-top formation, with peaks on 4 apr and 7 mar. Neckline is still the 7.40 support (pink --). So it'll be critical for SGX to stay above this support to have any chance of a recovery.
However, if SGX breaks the 7.40 support (pink --), and the long term downtrend support (mid red), the next support could be at the 7.00 level, where the long term downtrend support (low red) meets the downtrend support (low pink).

For monday :
Support @ 7.36 (low blue), 7.204 (mid red), 7.063 (low pink),
Resistance @ 7.40 (pink --), 7.63 (blue --), 7.73 (mid pink), 7.86 (upp blue), 8.00 (upp red, blue ...)
Hope you find my analysis helpful. Thank you !!
SGX looks to have formed a double-top formation, with peaks on 4 apr and 7 mar. Neckline is still the 7.40 support (pink --). So it'll be critical for SGX to stay above this support to have any chance of a recovery.
However, if SGX breaks the 7.40 support (pink --), and the long term downtrend support (mid red), the next support could be at the 7.00 level, where the long term downtrend support (low red) meets the downtrend support (low pink).

For monday :
Support @ 7.36 (low blue), 7.204 (mid red), 7.063 (low pink),
Resistance @ 7.40 (pink --), 7.63 (blue --), 7.73 (mid pink), 7.86 (upp blue), 8.00 (upp red, blue ...)
Hope you find my analysis helpful. Thank you !!
Sunday, June 8, 2008
SGX 060608
Ever since SGX broke the 8.95 support (red --) on 20 may, it has been on a downtrend, and SGX also broke the 8.24 support (green --) on 26 may. Afterwhich, SGX has tested the critical 7.94 support (blue ...) 3 times.
If the 7.94 support breaks, we could see SGX testing the 7.64 support (blue --), then the next support would be at the 7.40 support (green ...). If SGX breaks the 7.40 support, which is also near the long term downtrend support (low red), we could see a repeat of the downtrend in march.

For monday :
Support @ 7.94 (blue ...), 7.82 (low pink), 7.64 (blue --), 7.50 (low red), 7.40 (green ...)
Resistance @ 8.20 (low blue, mid pink), 8.24 (green --), 8.31 (upp red), 8.43 (upp blue)
Hope you find my analysis helpful. Thank you !!
If the 7.94 support breaks, we could see SGX testing the 7.64 support (blue --), then the next support would be at the 7.40 support (green ...). If SGX breaks the 7.40 support, which is also near the long term downtrend support (low red), we could see a repeat of the downtrend in march.

For monday :
Support @ 7.94 (blue ...), 7.82 (low pink), 7.64 (blue --), 7.50 (low red), 7.40 (green ...)
Resistance @ 8.20 (low blue, mid pink), 8.24 (green --), 8.31 (upp red), 8.43 (upp blue)
Hope you find my analysis helpful. Thank you !!
Sunday, May 11, 2008
SGX 090508
After failing to break the 9.60 neckline (pink --) thrice, SGX weakened tremendously and has now broken the uptrend support (low blue), as well as the 8.95 neckline (red --).

SGX went on to test the long term downtrend support (upp pink) today, but managed to close right on the trendline.
If SGX breaks downtrend support (upp pink), we could see it testing the 8.24 support (green --).
Otherwise, next week could see SGX trading between the 8.95 neckline (red --) and the downtrend support (upp pink).
For monday :
Support @ 8.68 (upp pink), 8.24 (low pink, green --), 8.12 (low red)
Resistance @ 8.95 (red --), 9.08 (low blue), 9.27 (upp blue), 9.45 (upp red), 9.60 (pink --)
Good Luck !!

SGX went on to test the long term downtrend support (upp pink) today, but managed to close right on the trendline.
If SGX breaks downtrend support (upp pink), we could see it testing the 8.24 support (green --).
Otherwise, next week could see SGX trading between the 8.95 neckline (red --) and the downtrend support (upp pink).
For monday :
Support @ 8.68 (upp pink), 8.24 (low pink, green --), 8.12 (low red)
Resistance @ 8.95 (red --), 9.08 (low blue), 9.27 (upp blue), 9.45 (upp red), 9.60 (pink --)
Good Luck !!
Sunday, April 27, 2008
SGX 250408
SGX 1st broke above the long term uptrend resistance (green) on 21 apr. However, the next 2 days (22 and 23 apr) saw SGX opening below this resistance, before closing above it.

Finally on 24 apr, SGX opened above the uptrend resistance (green) again. But this time, it also broke another uptrend resistance (mid blue) and also tested the 8.95 resistance level (red --), before closing above the uptrend resistance now turned support (mid blue).
You can see from the huge volume done (grey boxes on the left of the chart) for the 8.75 - 8.83 region that this would be a good support for SGX. That's why today, SGX touched the 8.83 support before recovering to close above the 8.95 resistance level (red --). SGX did not even touch the uptrend support (mid blue) today.
Whether SGX can open above the 8.95 resistance (red --) on monday remains to be seen as the volume today was much lesser compared to thursday (9.6m vs 15.7m). There's also quite a chunk done at the 8.95 - 9.08 region so this could be quite a resistance for SGX to overcome.
However, if SGX can open above the 8.95 resistance level (red --) and break the uptrend resistance (upp blue) with volume, the next resistance for SGX could be around the 9.75 level.
If SGX fails to hold on to its uptrend support (mid blue), we might see it consolidating around the uptrend support (green).
For monday :
Support @ 8.97 (upp pink), 8.95 (upp red, red --), 8.88 (mid blue), 8.60 (low blue), 8.51 (low pink), 8.38 (green)
Resistance @ 9.14 (upp blue), 9.33 (blue ....), 9.45
Good Luck !!

Finally on 24 apr, SGX opened above the uptrend resistance (green) again. But this time, it also broke another uptrend resistance (mid blue) and also tested the 8.95 resistance level (red --), before closing above the uptrend resistance now turned support (mid blue).
You can see from the huge volume done (grey boxes on the left of the chart) for the 8.75 - 8.83 region that this would be a good support for SGX. That's why today, SGX touched the 8.83 support before recovering to close above the 8.95 resistance level (red --). SGX did not even touch the uptrend support (mid blue) today.
Whether SGX can open above the 8.95 resistance (red --) on monday remains to be seen as the volume today was much lesser compared to thursday (9.6m vs 15.7m). There's also quite a chunk done at the 8.95 - 9.08 region so this could be quite a resistance for SGX to overcome.
However, if SGX can open above the 8.95 resistance level (red --) and break the uptrend resistance (upp blue) with volume, the next resistance for SGX could be around the 9.75 level.
If SGX fails to hold on to its uptrend support (mid blue), we might see it consolidating around the uptrend support (green).
For monday :
Support @ 8.97 (upp pink), 8.95 (upp red, red --), 8.88 (mid blue), 8.60 (low blue), 8.51 (low pink), 8.38 (green)
Resistance @ 9.14 (upp blue), 9.33 (blue ....), 9.45
Good Luck !!
Sunday, April 13, 2008
SGX 110408
After testing the 8.95 resistance (red --) on 4 apr, SGX weakened and broke the long term uptrend support (green) and closed right on the downtrend support (low red) on 9 apr.

SGX recovered a little and is now trading within the short term uptrend channel (blue). If SGX can maintain trading within this channel (blue), it might have a chance of breaking the uptrend resistance (green).
If SGX breaks below this channel (blue), we might see it testing the 7.64 support (blue --).
For monday :
Support @ 8.01 (low blue), 7.76 (low red), 7.64 (blue --), 7.36 (low pink)
Resistance @ 8.34 (green, upp blue), 8.50 (upp pink), 8.57 (upp red)
Good Luck !!

SGX recovered a little and is now trading within the short term uptrend channel (blue). If SGX can maintain trading within this channel (blue), it might have a chance of breaking the uptrend resistance (green).
If SGX breaks below this channel (blue), we might see it testing the 7.64 support (blue --).
For monday :
Support @ 8.01 (low blue), 7.76 (low red), 7.64 (blue --), 7.36 (low pink)
Resistance @ 8.34 (green, upp blue), 8.50 (upp pink), 8.57 (upp red)
Good Luck !!
Sunday, March 30, 2008
SGX 280308
SGX was trading sideways after breaking out of the long term downtrend resistance (red --). However, SGX is still trading within the uptrend channel (blue), and it also tested the downtrend resistance (upp pink).

From the chart, you can see that SGX is getting closer and closer to the long term uptrend resistance (green). If SGX can continue to trade within the uptrend channel (blue),, and open above the downtrend resistance (upp pink) on monday, there is a high chance SGX can break the downtrend resistance (green). Of course, there must be volume.
For monday :
Support @ 7.566 (low blue, upp red), 6.736 (low red), 6.00 (low pink), 5.885 (red --)
Resistance @ 7.81 (upp pink), 8.275 (green), 8.60 (upp blue)
Good Luck !!

From the chart, you can see that SGX is getting closer and closer to the long term uptrend resistance (green). If SGX can continue to trade within the uptrend channel (blue),, and open above the downtrend resistance (upp pink) on monday, there is a high chance SGX can break the downtrend resistance (green). Of course, there must be volume.
For monday :
Support @ 7.566 (low blue, upp red), 6.736 (low red), 6.00 (low pink), 5.885 (red --)
Resistance @ 7.81 (upp pink), 8.275 (green), 8.60 (upp blue)
Good Luck !!
Thursday, March 27, 2008
SGX 260308
SGX broke out of the long term downtrend channel (red --) at the beginning of the week and is currently trading within the short term uptrend chaanel (blue).

There were some softening detected today, which could be due to profit taking. If SGX managed to break the downtrend resistance (upp red), we might see it testing the long term uptrend resistance (green).
For tomorrow :
Support @ 7.40 (low blue), 6.894 (low red)
Resistance @ 7.63 (upp pink), 7.70 (upp red), 8.29 (green, upp blue)
Good Luck !!

There were some softening detected today, which could be due to profit taking. If SGX managed to break the downtrend resistance (upp red), we might see it testing the long term uptrend resistance (green).
For tomorrow :
Support @ 7.40 (low blue), 6.894 (low red)
Resistance @ 7.63 (upp pink), 7.70 (upp red), 8.29 (green, upp blue)
Good Luck !!
Sunday, March 16, 2008
SGX 140308
There wasn't any follow through after SGX broke the 2 long term downtrend resistances (red, upp red --) on 12 mar.
 (Please note that the volume is wrongly indicated)
Subsequently, SGX traded below these resistances, and even broke the downtrend support (low pink) on 13 mar. SGX even opened and closed just below the downtrend support (low pink) today. Only positive note was it seems to have found some support about the 6.62 - 6.68 region.
If SGX continues to trade within this downtrend channel (red --), it might test the 6.00 level soon.
For monday :
Support @ 6.796 (low pink), 6.247 (mid red --), 5.795 (low red --)
Resistance @ 6.91 (red), 7.05 (upp red --), 7.716 (upp pink)
Good Luck !!
 (Please note that the volume is wrongly indicated)
Subsequently, SGX traded below these resistances, and even broke the downtrend support (low pink) on 13 mar. SGX even opened and closed just below the downtrend support (low pink) today. Only positive note was it seems to have found some support about the 6.62 - 6.68 region.
If SGX continues to trade within this downtrend channel (red --), it might test the 6.00 level soon.
For monday :
Support @ 6.796 (low pink), 6.247 (mid red --), 5.795 (low red --)
Resistance @ 6.91 (red), 7.05 (upp red --), 7.716 (upp pink)
Good Luck !!
Sunday, March 9, 2008
SGX 070308
SGX broke the long term uptrend support (low green) on 1 mar, and even went on to break the 7.65 (17 aug low) on 5 mar.

SGX has now also broken the long term downtrend support (red) on 7 mar. SGX is currently trading within the downtrend channel (red --). If SGX continues to trade within this channel, we might see it testing the 6.00 soon.
For monday :
Support @ 7.00 (low pink), 6.946 (mid red --), 6.458 (low red --)
Resistance @ 7.223 (red), 7.695 (upp red --), 7.89 (upp pink), 8.23 (low green)
Good Luck !!

SGX has now also broken the long term downtrend support (red) on 7 mar. SGX is currently trading within the downtrend channel (red --). If SGX continues to trade within this channel, we might see it testing the 6.00 soon.
For monday :
Support @ 7.00 (low pink), 6.946 (mid red --), 6.458 (low red --)
Resistance @ 7.223 (red), 7.695 (upp red --), 7.89 (upp pink), 8.23 (low green)
Good Luck !!
Sunday, March 2, 2008
SGX 290208
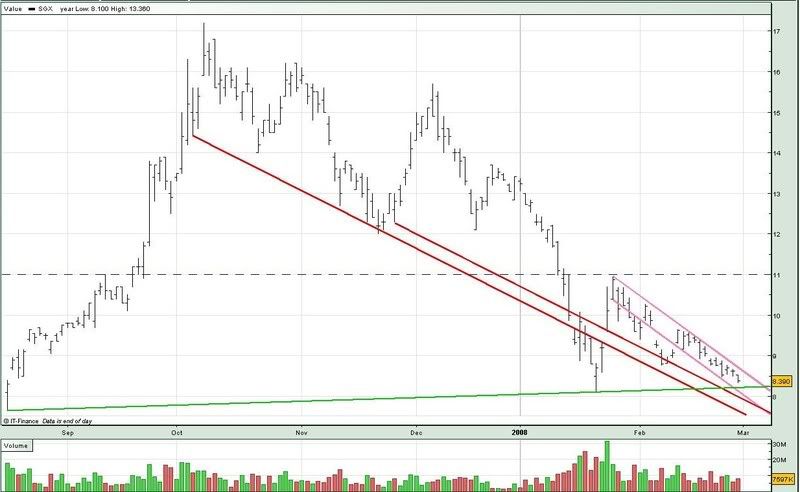
The closest SGX came to testing the 11.00 psychological resistance was on 25 jan. After that, it has been a downhill ride for SGX.

From the chart, you can see that SGX is trading within many downtrend channels. From the big picture, you can also see that SGX is getting closer and closer to the long term uptrend support (low green).
If that support breaks, we might see SGX testing the 7.65 low on 17 aug.
For monday :
Support @ 8.338 (upp red --), 8.20 (low green), 8.032 (low pink), 7.78 (low red --), 7.558 (low red)
Resistance @ 8.60 (upp pink), 8.896 (upp green), 9.34 (upp red)
Good Luck !!

From the chart, you can see that SGX is trading within many downtrend channels. From the big picture, you can also see that SGX is getting closer and closer to the long term uptrend support (low green).
If that support breaks, we might see SGX testing the 7.65 low on 17 aug.
For monday :
Support @ 8.338 (upp red --), 8.20 (low green), 8.032 (low pink), 7.78 (low red --), 7.558 (low red)
Resistance @ 8.60 (upp pink), 8.896 (upp green), 9.34 (upp red)
Good Luck !!
Sunday, February 3, 2008
SGX 010208
SGX almost touched the psychological resistance of 11.00 (10.96) on 25 jan, before retreating.

Could SGX be doing a double-bottom?
For monday :
Support @ 9.57 (low blue), 9.15 (upp red), 9.00 (low pink), 8,787 (low red)
Resistance @ 9.70 (upp pink), 10.27 (upp blue)

Could SGX be doing a double-bottom?
For monday :
Support @ 9.57 (low blue), 9.15 (upp red), 9.00 (low pink), 8,787 (low red)
Resistance @ 9.70 (upp pink), 10.27 (upp blue)
Thursday, January 17, 2008
SGX 160108
SGX failed to find support on the neckline (blue - - -) after completing the Head and Shoulders (H&S) formation on 14 jan.

I've added a parallel downtrend (red) which joins the lows of 4 oct, 20 nov and 23 nov. From the chart, you can also see that SGX traded below this downtrend support (low red) today (16 jan).
It will be awhile before we can see SGX testing the 11.00 resistance.
For 17 jan :
Support @ 9.01 (upp pink - - -), 8.39 (low pink - - -)
Resistance @ 9.557 (low red), 10.358 (low pink), 11.00 (neckline)
Good Luck !!

I've added a parallel downtrend (red) which joins the lows of 4 oct, 20 nov and 23 nov. From the chart, you can also see that SGX traded below this downtrend support (low red) today (16 jan).
It will be awhile before we can see SGX testing the 11.00 resistance.
For 17 jan :
Support @ 9.01 (upp pink - - -), 8.39 (low pink - - -)
Resistance @ 9.557 (low red), 10.358 (low pink), 11.00 (neckline)
Good Luck !!
Saturday, January 5, 2008
SGX 040108
SGX broke below the uptrend support (lower blue) on 3 jan. And it touched the downtrend support (lower red) today.

SGX looks to continue to trade within the downtrend channel (red).
For Monday :
Support @ 12.458 (lower red), 12.33 (upper purple), 12.00 (lower purple)
Resistance @ 12.84 (middle red), 13.12 (upper red), 13.28 (lower blue)
Good Luck !!

SGX looks to continue to trade within the downtrend channel (red).
For Monday :
Support @ 12.458 (lower red), 12.33 (upper purple), 12.00 (lower purple)
Resistance @ 12.84 (middle red), 13.12 (upper red), 13.28 (lower blue)
Good Luck !!
Wednesday, January 2, 2008
SGX 020108
SGX most likely will be trading sideways for the next few days. However, it is still trading below the long term uptrend support (green).

From the chart, you will notice that SGX broke above the downtrend resistance (purple). However, it would need to break somemore resistance lines - the 2 upper blue lines + green line.
For tomorrow :
Support @ 13.02 (middle red, lower blue converge), 12.60
Resistance @ 13.31, 13.70
Good Luck !!

From the chart, you will notice that SGX broke above the downtrend resistance (purple). However, it would need to break somemore resistance lines - the 2 upper blue lines + green line.
For tomorrow :
Support @ 13.02 (middle red, lower blue converge), 12.60
Resistance @ 13.31, 13.70
Good Luck !!
Subscribe to:
Posts (Atom)


 Posts