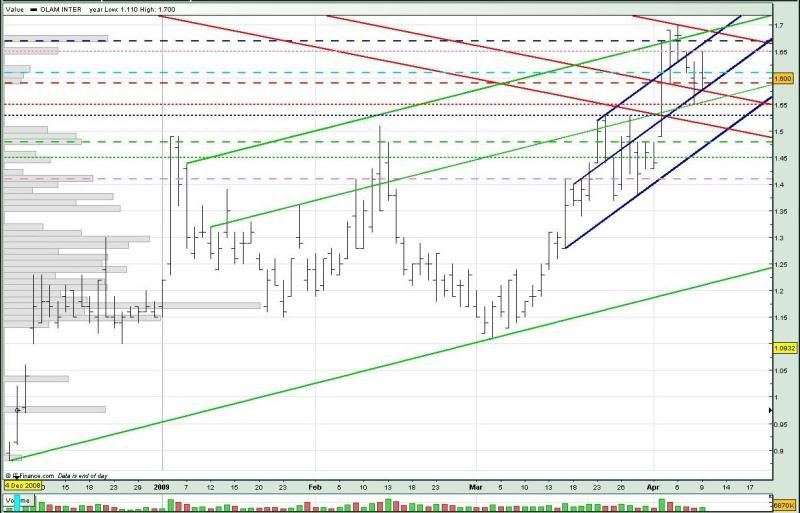
Olam has been on the uptrend since the beginning of march, bursting into life on 2 apr after trading sideways the week before that.
If Olam breaks the 1.59 support (red --), we could see it trading between the 1.53 support (blue ...) and 1.59 neckline (red --).
However, if Olam and stay above the 1.59 support, we could see it trading sideways also, but between the 1.59 support (red --) and 1.65 resistance (pink ...). And if Olam can trade within the uptrend channel (blue), we might even see it test the 1.65 resistance towards the end of the week.

For monday :
Support @ 1.59 (mid blue, red --), 1.57 (mid red), 1.56 (mid green), 1.55 (red ...), 1.53 (blue ...), 1.51 (low red), 1.48 (low blue, green --)
Resistance @ 1.61 (lightblue --), 1.62, 1.65 (pink ...), 1.67 (upp blue, blue --), 1.69 (upp green, upp red)


No comments:
Post a Comment