Disclaimer

Disclaimer:-Please note that all such analysis is provided by way of information only. All of the information was and should be taken as having been prepared for the purpose of reference only and that none were made with regard to any specific investment objective, financial situation or the needs of any particular person who may receive the analysis. Any recommendation or advice that may be expressed in or inferred from such analysis therefore does not take into account and may not be suitable for your investment objective.

Wednesday, October 22, 2008

SPC 221008

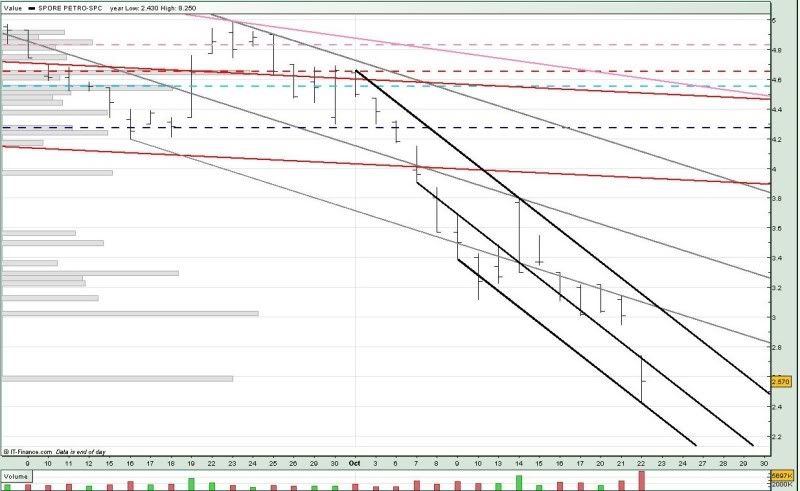
The 1st hint of warning came on 6 oct when SPC broke the 4.27 neckline support (blue --). Confirmation came the next day when SPC broke the long term downtrend support (low red) and downtrend support (mid grey) with volume.

As you can see from the chart, SPC spiralled down after that and the highest it came back to was to test the downtrend resistance (mid grey) again on 14 oct. I've just added in the short-term downtrend channel (black). After 15 oct, SPC never closed above the downtrend resistance (mid grey).

Today, it gapped down and opened right on the short-term downtrend resistance (mid black), more importantly, it broke down with volume, just like it did on 7 oct.

As it stands now, things don't look too good for SPC. There could be some sideway tradings but I guess it's going to trend within the downtrend channel (black).
Photobucket

For tomorrow :

Support @ 2.57, 2.31 (low black)
Resistance @ 2.64 (mid black), 3.01 (pink --), 3.07 (low grey, upp black)

No comments: