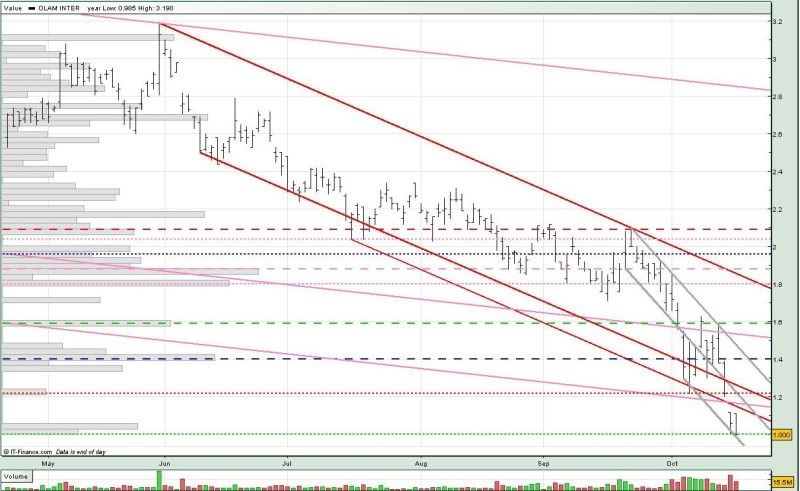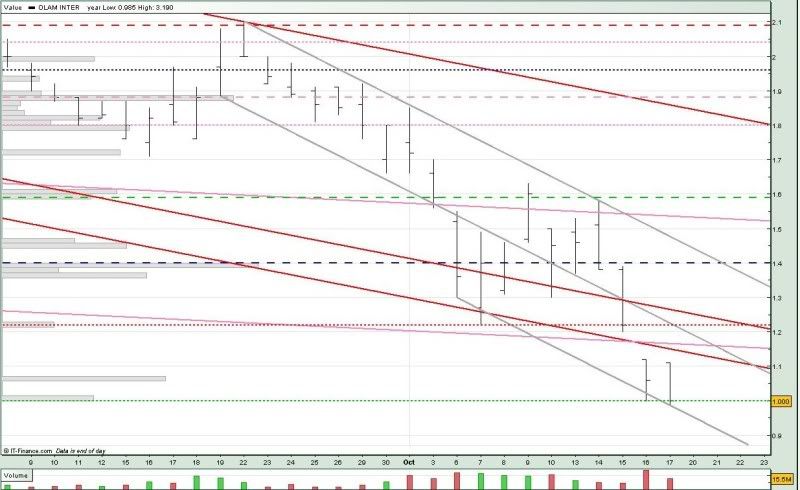
On 16 oct, Olam opened below the long term downtrend support (low pink) testing the 1.00 psychological level. We could see Olam trading between 1.00 and the downtrend resistance (low red) this week.
If Olam breaks the 1.00 level, we could see it hitting the 0.900 level as indicated by the downtrend support (low grey).

For monday :
Support @ 1.00 (green ...), 0.950 (low grey)
Resistance @ 1.138 (low red), 1.163 (low pink), 1.20 (mid grey), 1.22 (red ...), 1.25 (mid red)


No comments:
Post a Comment