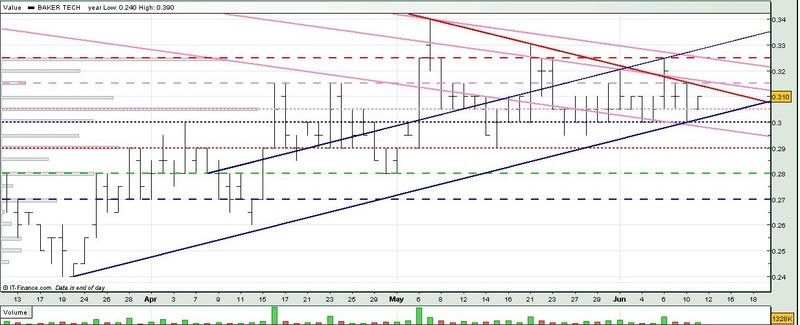
If we were to assume history repeats itself, we could see BakerTech trading sideways at least until next week, when the long term downtrend resistance (red) meets the uptrend support (low blue) at around the 0.307 level, which would be the average number of days (9-12 days) between the high volume days.

For tomorrow :
Support @ 0.305 (pink ...), 0.302 (low blue), 0.300 (blue ...), 0.2975 (low pink), 0.290 (red ...)
Resistance @ 0.313 (red), 0.315 (mid pink, pink --), 0.325 (upp pink, red --), 0.329 (upp blue)
Hope you find my analysis helpful. Thank you !!


No comments:
Post a Comment