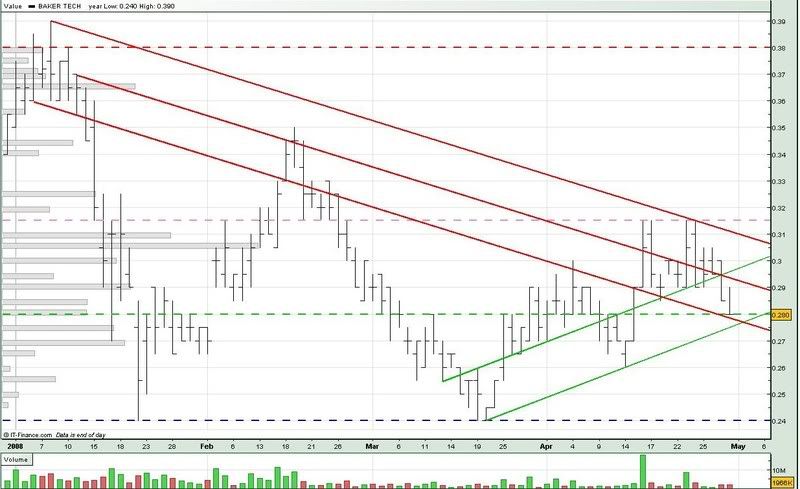
BakerTech is now trading below the uptrend and downtrend support-turned-resistance (mid red, upp green). BakerTech has also hit the 0.280 support level (green --) today.
From the volume distribution bars on the left of the chart, we can see that if the 0.280 support breaks, 0.275 and 0.270 are the next 2 support levels.
If Baker Tech manages to bounce off the uptrend support (low green) and downtrend support (low red), we might see it consolidating around the 0.280 support (green --).
If the 0.280 support, as well as the 0.275 and 0.270 support, breaks, we might see BakerTech retreating all the way to the 0.240 support (blue --).
For friday :
Support @ 0.280 (green --), 0.277 (low red), 0.276 (low green), 0.270, 0.240 (blue --)
Resistance @ 0.2925 (mid red), 0.297 (upp green), 0.310 (upp red)
Good Luck !!


No comments:
Post a Comment