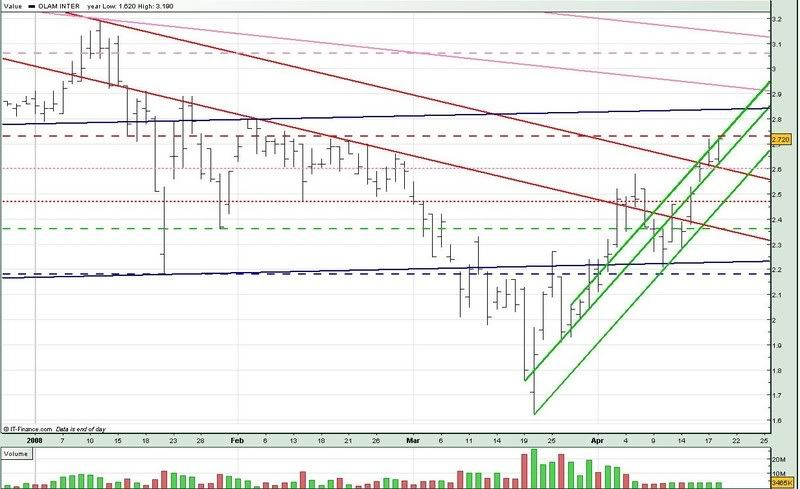
Olam has been on the uptrend since 10 apr but average volume has been less than 3,500. Since Olam has hit the 2.73 neckline (red --), we might see it trading sideways next week.
However, if Olam can maintain trading within the uptrend channel (green), and breaks the 2.73 neckline (red --), we might see Olam testing the long term uptren resistance (upp blue).
For monday :
Support @ 2.657 (mid green), 2.60 (upp red, pink ...), 2.48 (low green), 2.47 (red ...), 2.36 (low red, green --)
Resistance @ 2.73 (red --), 2.76 (upp green), 2.836 (upp blue), 2.92 (low pink)
Good Luck !!


No comments:
Post a Comment