
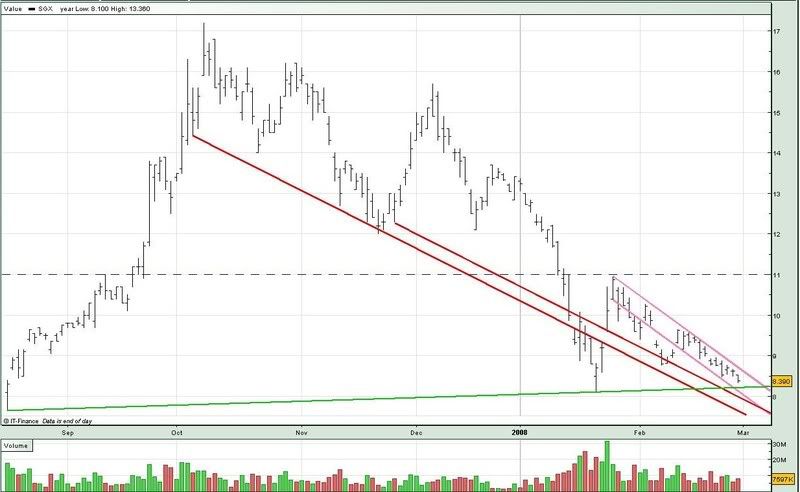
From the chart, you can see that SGX is trading within many downtrend channels. From the big picture, you can also see that SGX is getting closer and closer to the long term uptrend support (low green).
If that support breaks, we might see SGX testing the 7.65 low on 17 aug.
For monday :
Support @ 8.338 (upp red --), 8.20 (low green), 8.032 (low pink), 7.78 (low red --), 7.558 (low red)
Resistance @ 8.60 (upp pink), 8.896 (upp green), 9.34 (upp red)
Good Luck !!


No comments:
Post a Comment