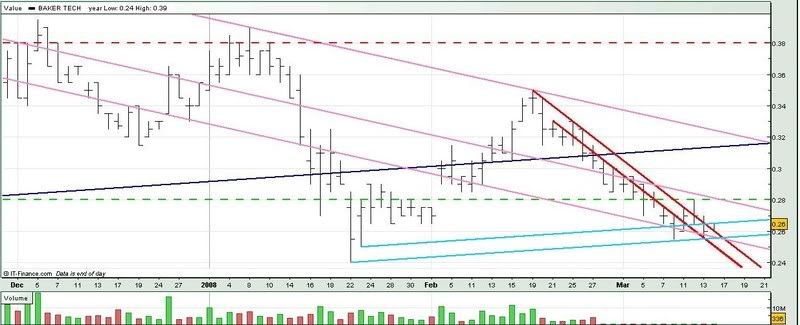
 (Please note that volume is wrongly indicated)
Although BakerTech traded above the downtrend resistance (upp red), volume was extremely low (336 lots), making it a possibility of a false break.
If BakerTech breaks the uptrend support (low light blue), it would probably trade within the downtrend channel (red) and test the 0.24 level.
For monday :
Support @ 0.255 (low pink, low light blue, upp red), 0.245 (low red)
Resistance @ 0.265 (upp light blue), 0.280 (mid pink, green --)
Good Luck !!


No comments:
Post a Comment