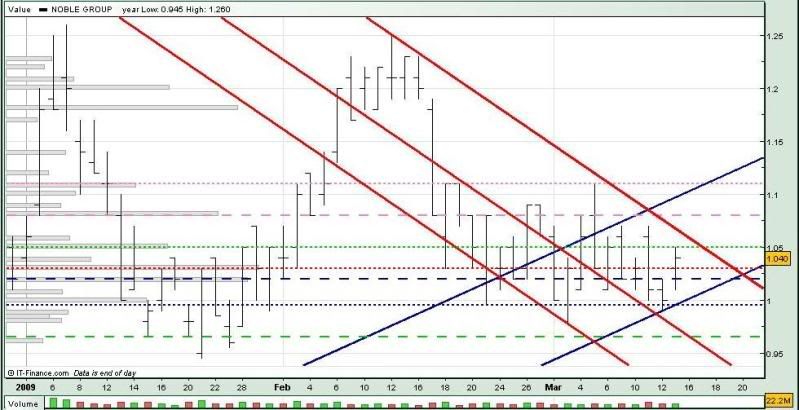
Will we see Noble Group bursting into life like it did in mid Jan ?
As you can see from the chart, the downtrend resistance (upp red), meets the uptrend support (low blue) at the 1.025 level sometime next week. Which means we could see some action for Noble Group soon.
If Noble Group doesn't break the 0.995 support (blue ...) by then, there's a great chance we could see a repeat of the surging run in mid jan.
However, if the 0.995 support breaks, we could see Noble Group fall as dramatically, which isn't unusual for Noble Group.

For monday :
Support @ 1.03 (red ...), 1.02 (blue --), 1.00 (low blue), 0.995 (blue ...), 0.965 (mid red, green --), 0.935 (red --)
Resistance @ 1.05 (green ...), 1.06 (upp red), 1.08 (pink --), 1.10 (upp blue), 1.11 (pink ...)


No comments:
Post a Comment