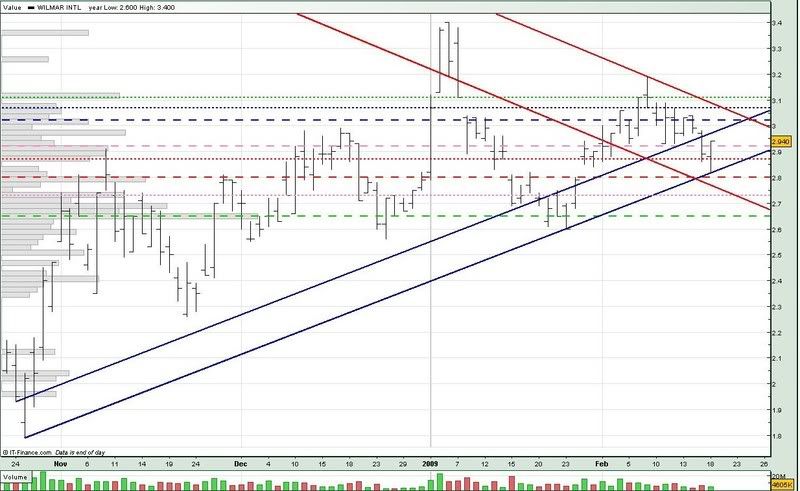
Wilmar formed a double top on 6 jan and 9 feb. It would be interesting to see if Wilmar can stay above the 2.92 support (pink --) as you can see from the volume chart, the 2.92 support is quite strong. So for Wilmar to open below the 2.92 level but close above it, we could be looking at the beginning of a trend reversal.
For that to happen, Wilmar has to at least stay above the 2.80 support (red --) and continue to trade within the uptrend channel (blue). If this happens, we could see some action later this week or early next, when the downtrend resistance (upp red) meets the uptrend resistance (upp blue) at the 3.02 neckline (blue --).
However, if Wilmar breaks the 2.80 support (red --), we could see it test at least the 2.73 support (pink ...), which is also where the downtrend support (low red) meets.

For tomorrow :
Support @ 2.92 (pink --), 2.87 (red ...), 2.83 (low blue), 2.80 (red --), 2.75 (low red), 2.73 (pink ...)
Resistance @ 2.98 (upp blue), 3.02 (blue --), 3.07 (upp red, blue ...), 3.11 (green ...)


No comments:
Post a Comment