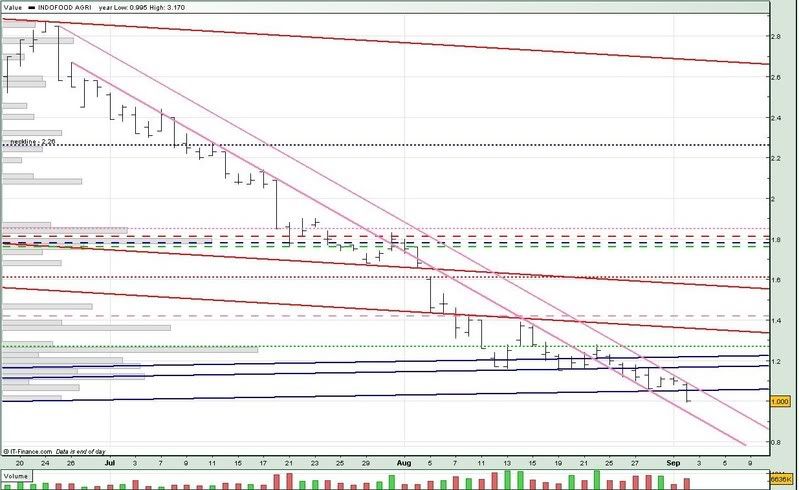
Indofood Agri's fate has taken a turn for the worse and has now broken the uptrend support (low blue) today, so we could be looking at 0.900 as being the next support (23 aug 07 low).
After hitting the 1.27 resistance on 22 aug, Indofood Agri softened, breaking the uptrend support (mid blue) and testing the 1st downtrend support (mid pink) on 26 aug.
Indofood Agri is still currently trading within the downtrend channel (pink). It is also trading below the long term downtrend support (low red).
For tomorrow :
Support @ 1.00, 0.905 (low pink), 0.900 (23 aug 07 low)
Resistance @ 1.05 (low blue, upp pink), 1.16 (mid blue), 1.22 (upp pblue)
Sunday, August 31, 2008
Saturday, August 30, 2008
Ferro China 290808
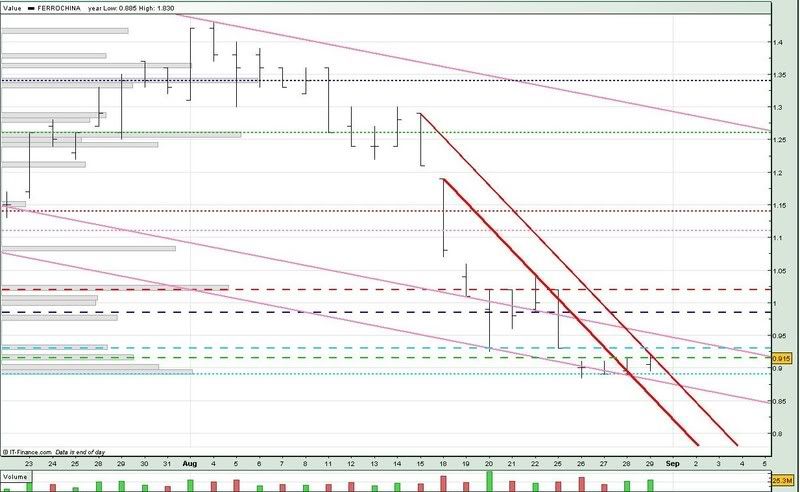
After breaking the 0.985 support (blue --) on 25 aug, we saw Ferro China almost testing the long term downtrend support (low pink). We did see FerroChina breaking the support the following day (26 aug) but it seems Ferro China found some support at the 0.890 level (lightblue ...).
We could be looking at FerroChina attempting to consolidate around the 0.890 - 0.900 levels next week, provided it doesn't break the 0.890 support (lightblue ...).
If the 0.890 support breaks, we could see Ferro China testing the 0.800 level.
For monday :
Support @ 0.890 (lightblue ...), 0.885 (upp red), 0.875 (low pink), 0.820 (low red)
Resistance @ 0.915 (green --), 0.930 (lightblue --), 0.945 (mid pink), 0.985 (blue --)
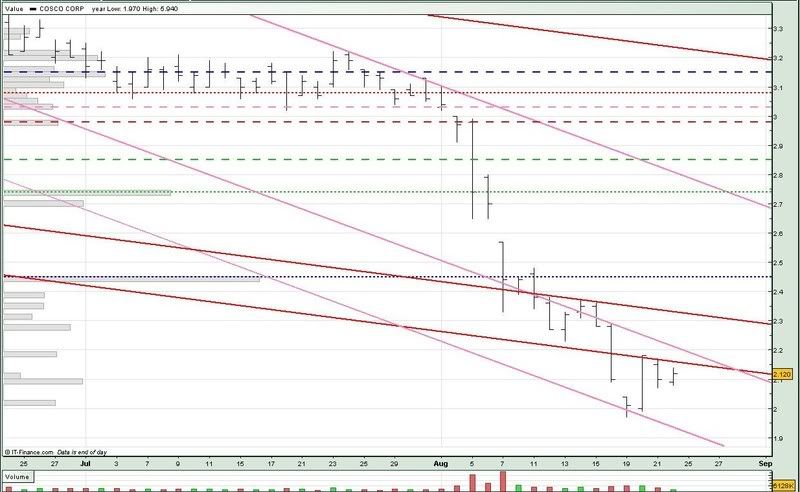
Cosco 290808
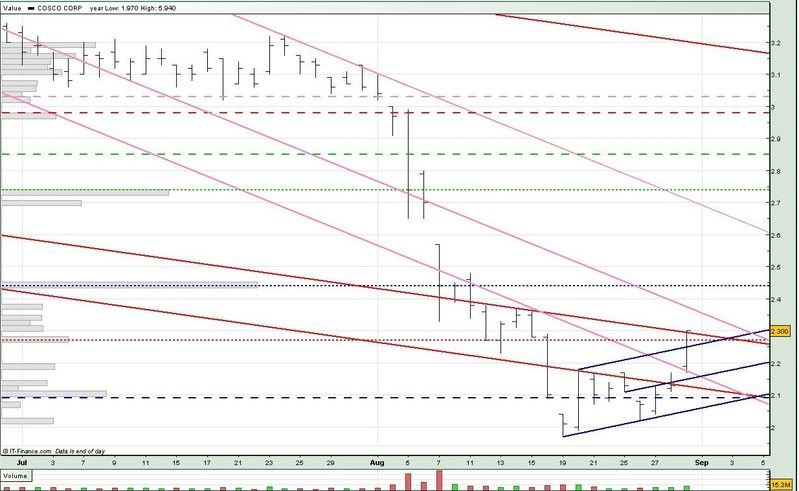
We did indeed see some action for Cosco toward the end of the week when Cosco broke the long term downtrend resistance (low pink) and 2.27 resistance (red ...). Cosco closed right on the downtrend resistance (mid red).
Having said that, we have seen Cosco recovered almost 17% of its value since its low of 1.97 on 19 aug. Moreover, we saw Cosco hitting the resistance (mid red) today.
So we might see Cosco trading sideways next week, supported by the uptrend support (mid blue). I see the upside at most will be capped by the long term downtrend resistance (mid pink).
If Cosco can maintain trading within the uptrend channel (blue), we could see it attempting to break the long term downtrend resistance (mid pink) towards the end of next week.
For monday :
Support @ 2.287 (mid red), 2.27 (red ...), 2.26 (upp blue), 2.16 (mid blue), 2.154 (low pink), 2.12 (low red), 2.09 (blue --), 2.06 (low blue)
Resistance @ 2.355 (mid pink), 2.44 (blue ...), 2.69 (upp pink)
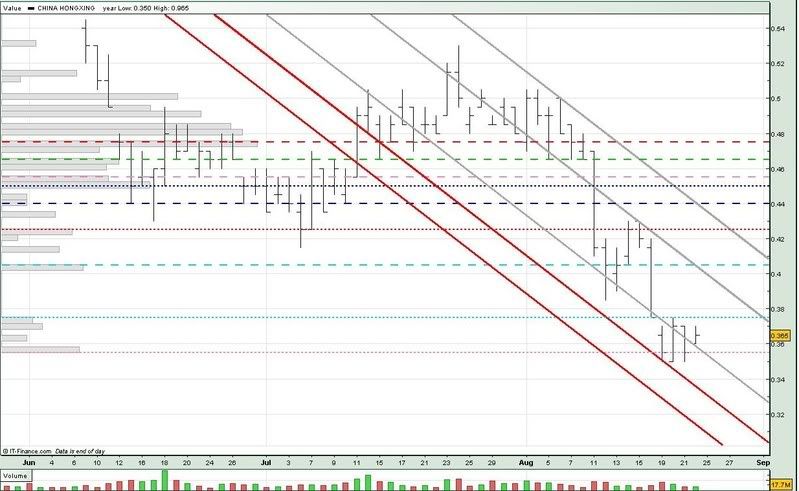
China HongX 290808
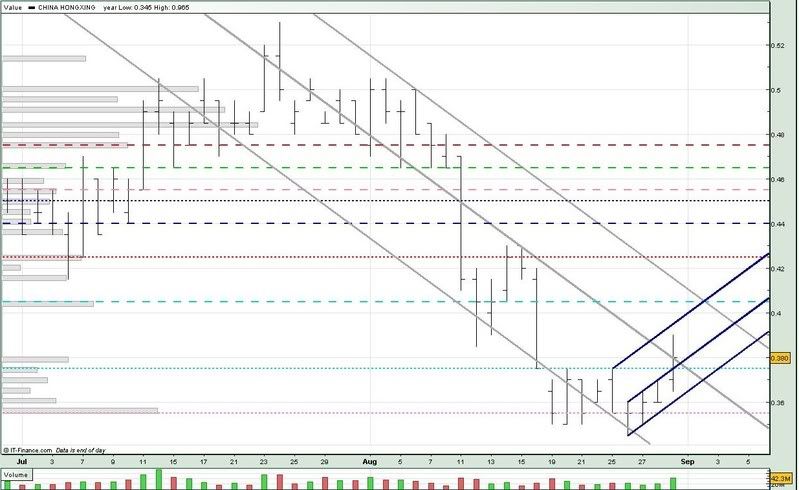
China Hongxing did reverse its downtrend after the Dragonfly Doji on 26 aug, recovered a little to break the 0.375 resistance (lightblue ...) and closed right on the 1st long term downtrend resistance (mid grey) today.
However, given the recent market sentiments, it remains to be seen if China Hongxing can maintain this uptrend momentum. If China Hongxing can open at 0.375 or above (mid grey, light blue ...) on monday, and stay above the 0.375 level, the chances of maintaining this uptrend momentum would be good.
If China Hongxing opens below the 0.375 level, or breaks the uptrend support (low blue), we could see it revisiting the 0.355 support (pink ...).
For monday :
Support @ 0.380 (mid blue), 0.375 (mid grey, light blue ...), 0.365 (low blue), 0.355 (pink ...)
Resistance @ 0.400 (upp blue), 0.405 (lightblue --), 0.410 (upp grey), 0.425 (red ...)
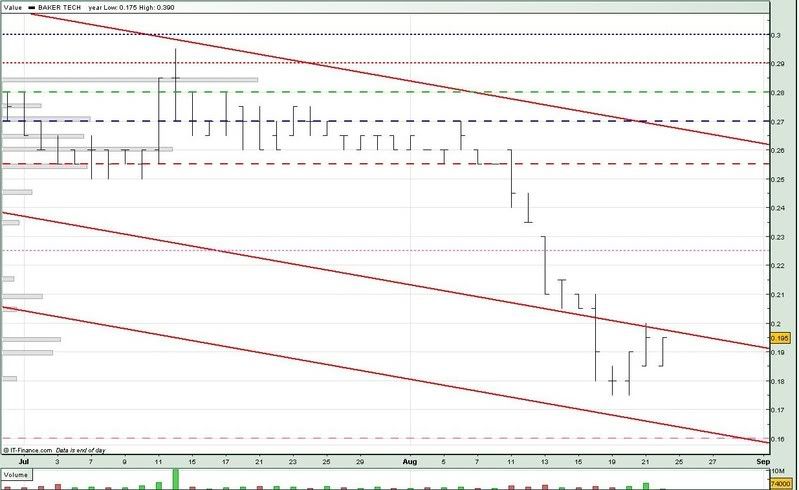
BakerTech 290808
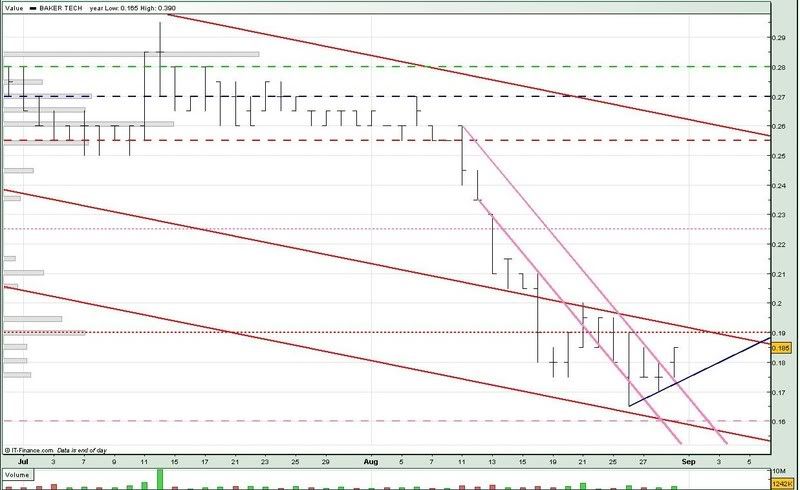
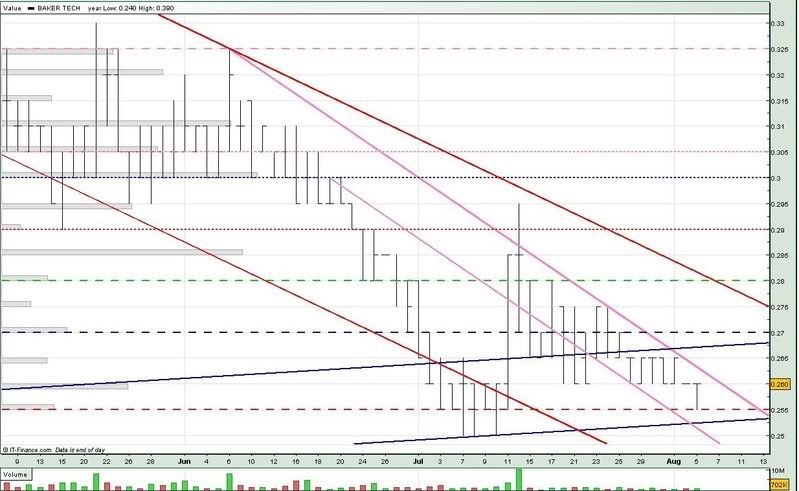
After almost testing the long term downtrend support (low red) on 26 aug, Bakertech seems to have found temporary support at the 0.175 level. Baker Tech also traded above the downtrend resistance (upp pink) today.
However, volume is still quite low so we could still see BakerTech trading sideways. If Baker Tech can continue to trade above the uptrend support (blue) next week, we could see some action towards the end of the week when the 1st long term downtrend resistance (mid red) meets the uptrend support (blue).
Short-term resistance based on volume distribution looks to be around the 0.190 level (red ...).
For monday :
Support @ 0.175 (blue), 0.167 (upp pink), 0.160 (pink --), 0.1585 (low red)
Resistance @ 0.190 (red ...), 0.192 (mid red)
Tuesday, August 26, 2008
Olam Research Report
by CIMB-GK (26 Aug)
We see increasing execution risks as the company expands into new and adjacent products, and new countries. Investing in upstream and downstream assets would also entail higher risks than operating an asset-light pure supply chain business.
The company needs capital to fund greater trade volumes, and acquistions and investments. The current yield of 13.7% for its debt implies a higher required rate of return on acquisitions/investments, and reduces its investment options available.
Management had delivered a 34% net profit compound annual growth rate (CAGR) in the past five years. We are cutting our FY2009-10 revenue estimates by 3% to 4%, and EPS estimates by 7% to 8% to account for increased volatility in commodity markets, which could lead to slimmer premiums and/or volumes.
Target price lowered to 16x CY2009 PER, at the low end of its historical trading band, from 27x CY09 PER.
-Research Report by CIMB-GK (26 Aug)
China HongX 260808
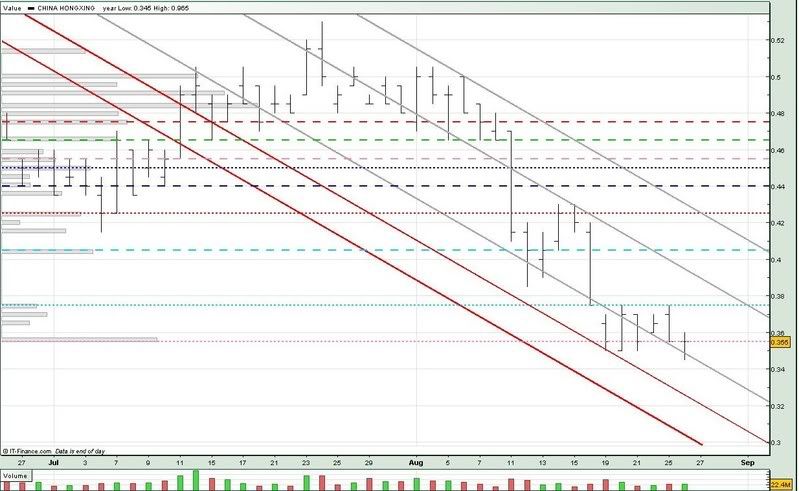
China Hongxing today tested the 1st long term downtrend support (low grey) before closing right on the 0.355 support (pink ...), forming a Dragonfly Doji.
Since China Hongxing has been on a downtrend prior to this Dragonfly Doji, technically, the Dragonfly Doji should indicate a reversal. Of course, the reversal indication would require a confirmation tomorrow.
We would need to see China Hongxing ideally gapping up and stay above at the least the 0.355 support (pink ...).
On the other hand, if China Hongxing breaks the 1st long term downtrend support (low grey), we could see it test the 0.320 level as indicated by the 2nd long term downtrend support (upp red).
For tomorrow :
Support @ 0.355 (pink ...), 0.342 (low grey), 0.320 (upp red), 0.300 (low red)
Resistance @ 0.375 (lightblue ...), 0.388 (mid grey), 0.405 (lightblue --)
Monday, August 25, 2008
China HongX Research Report
by DBS Vickers Securities (25 Aug)
All of China Hongxing's peers such as Li Ning, Anta and Dongxiang have seen significant valuation de-rating over the last six months, along with the declining Shanghai market.
China Hongxing itself has not been spared, and has seen its share price drop by over 40% in the last three months, despite delivering good results.
We believe current valuations for China Hongxing are at an attractive level for investors to accumulate for a leading China domestic sports. At less than 10x FY2008 and just over 7x FY2009 PER, China Hongxing is trading at less than half that of Li Ning, currently at about 25x FY2008 and 19x FY2009 earnings.
Maintaining our 20% discount to HK-listed peers, which are currently trading at an average of 13.5x FY2009 earnings, we adjust our target to 11x FY2009 PER for China Hongxing.
-Research Report by DBS Vickers Securities (25 Aug)
Sunday, August 24, 2008
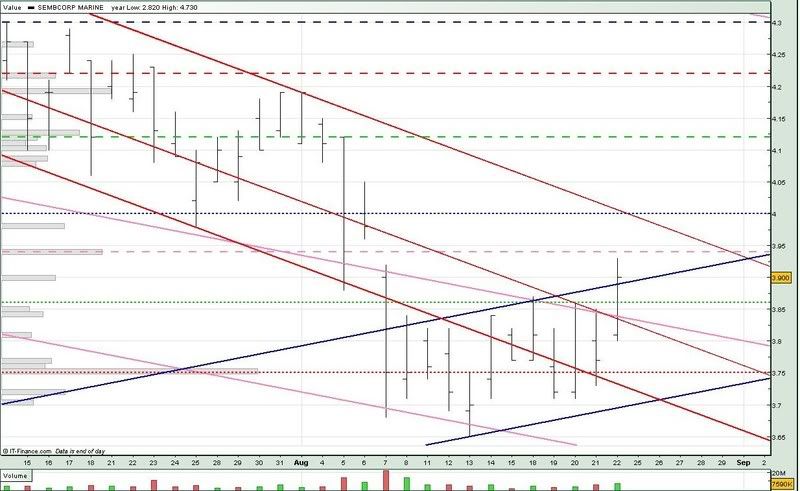
Semb Marine 220808
Sembcorp Marine traded more or less sideways for the last 2 weeks. Today, it broke the long term downtrend resistance (mid pink), downtrend resistance (mid red), and also the 3.86 resistance (green ...), closing just above the uptrend resistance (upp blue).
Sembcorp Marine also came very close to testing the 3.94 resistance (pink --). Whether Sembcorp Marine can break this resistance would depend very much if it can continue to trade at least above the 3.86 support (green ...).
If Sembcorp Marine manages to stay above the 3.86 support, we may be looking at some action next week, when the downtrend resistance (upp red) meets the uptrend resistance (upp blue) at around 3.93, just below the 3.94 resistance (pink --).
Otherwise, we could be looking at Sembcorp Marine trading between the 3.86 resistance (if Sembcorp Marine trades below it) and 3.75 support (red ...).
For monday :
Support @ 3.90 (upp blue), 3.86 (green ...), 3.83 (mid pink), 3.82 (mid red), 3.75 (red ...), 3.72 (low red), 3.70 (low blue)
Resistance @ 3.94 (pink --), 3.99 (upp red), 4.00 (blue ...), 4.05, 4.12 (green --)
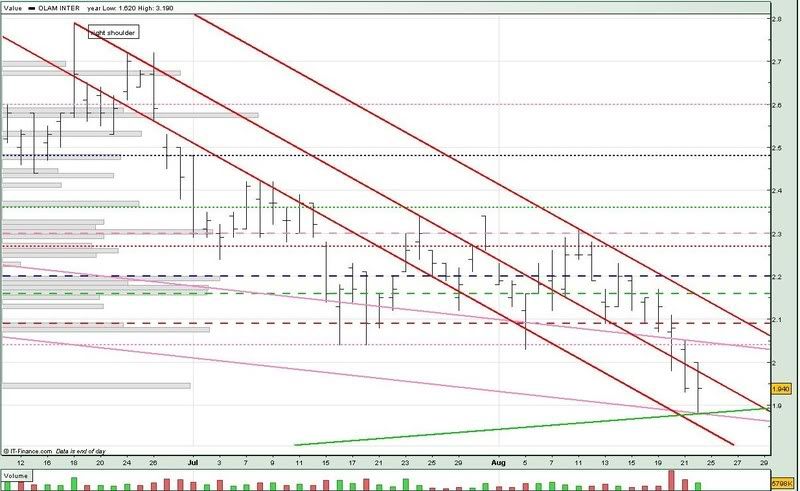
Olam 220808
20 aug was quite an important day for Olam. It was on this day that Olam broke several support trendlines with high volume (16m). Over the next few days, we saw Olam weakening further.
Olam also tested the long term downtrend support (low pink) today. If Olam breaks this support, we could see it testing the downtrend support (low red) and eventually hit the 1.80 level.
For monday :
Support @ 1.88 (low pink, green), 1.837 (low red)
Resistance @ 1.96 (mid red), 2.04 (mid pink, pink ...), 2.09 (red --), 2.143 (upp red), 2.16 (green --)
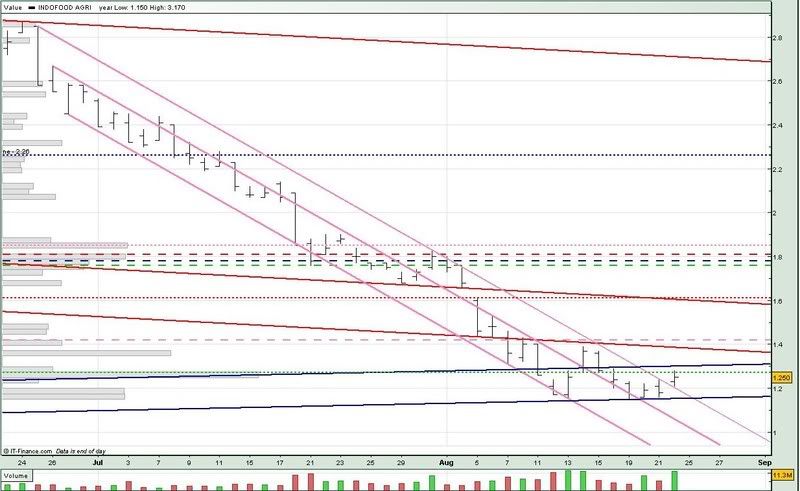
Indofood Agri 220808
Indofood Agri softened before it could hit the 1.40 level. It managed to find support around the 1.15 - 1.16 level, which it hit on 13 aug. Indofood Agri broke the downtrend resistance (upp pink) today.
As discussed previously, we would need Indofood Agri to break the 1.42 resistance (pink --) before we can confirm it has formed a double-bottom.
For next week, we may see Indofood Agri trading between the uptrend support (low blue) and uptrend resistance (upp blue) as it tries to form a base, with 1.27 (green ...) looking to be the short-term resistance.
For monday :
Support @ 1.17 (upp pink), 1.15 (low blue), 1.017 (mid pink)
Resistance @ 1.27 (green ...), 1.30 (upp blue), 1.38 (low red), 1.42 (pink --)
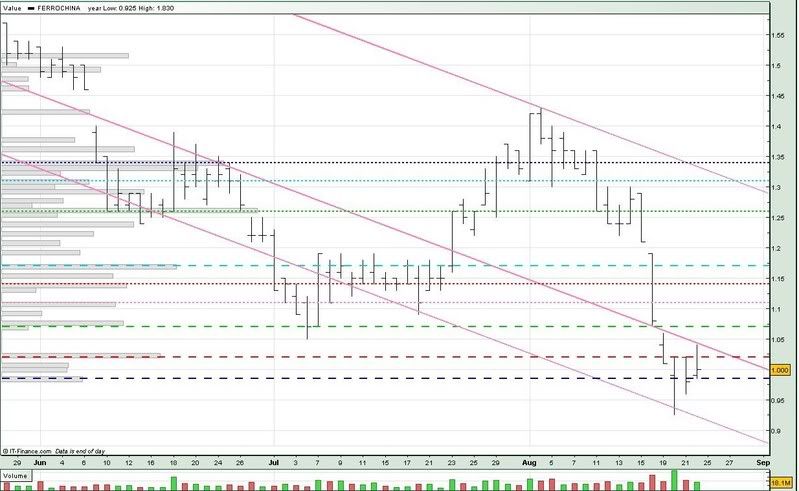
Ferro China 220808
Ferro China tested the long term downtrend support (low pink) after we last discussed on 19 aug. Based on the volume distribution bars, the resistance looks to be around the 1.02 level (red --) and the support around the 0.985 level (blue --).
We could be looking at FerroChina trading between these 2 levels for next week. We may see some action next week when the 1st long term downtrend resistance (mid pink) meets the 1.02 resistance (red --).
Even if Ferro China manages to break the 1st long term downtrend resistance (mid pink), its break would most likely to cap by the 1.07 resistance (green --).
There is also a possibility of FerroChina testing the long term downtrend support (low pink) if it breaks the 0.985 support (blue --).
For monday :
Support @ 0.985 (blue --), 0.960, 0.915 (low pink)
Resistance @ 1.02 (red --), 1.036 (mid pink), 1.07 (green --), 1.11 (pink ...), 1.14 (red ...)
Marine Sector Research Report
by DBS Group Research (20 Aug)
EARNINGS season in H1 2008 has reinforced positive outlook for rig builders, as well as oil and gas service and equipment suppliers. The rig builders, as well as oil and gas service and equipment players, have to-date delivered collectively stronger than expected H1 2008 report cards, underscoring their ability to ride on the positive sector outlook and protect profit margins despite raw material price concerns and weak US dollar.
Indeed, SGX-listed Singapore yards, and oil and gas service and equipment players' earnings have escaped the concerns earlier in the year unscathed; with new orders holding up, and ironically, US dollar rebounding and raw material price concerns easing recently. The exceptions were SGX-listed Chinese yards' earlier-than-expected dip in profit margins, which we had warned since mid-Q1 2008.
Undiscerning selldown in share prices in line with general market weakness has created buying opportunities. In our opinion, the earnings for most SGX-listed Singapore yards and oil and gas service and equipment suppliers have caught up with their share price valuations since early 2008, and the scenario has now reversed for the current depressed share prices to rebound, underpinned by the firm industry fundamentals and successful business execution.
Easing oil prices are positive for the durability of oil and gas industry up-cycle. We have repeatedly mentioned since last August that too high an oil price may result in demand destruction and harm the orderbook replenishment opportunities of stocks exposed to the booming offshore segment.
While the equity market sees the recent cooling off in crude oil price negatively, we are taking the view that the recent retracement in oil prices is reducing the risk of demand destruction and inflationary pressures. This is positive for more new order wins ahead.
This is also in line with rig builders' and oil and gas service and equipment suppliers' feedback that oil price at US$70 per barrel is a good level for their business outlook.
Sembcorp Marine is our top pick among the yards; with price catalyst coming from a possible record level of order wins this year and improving margins from successful execution of its record order book.
Swiber Holdings and Ezra Holding remain our top picks among the oil and gas service and equipment suppliers, as both companies have strong market positioning to ride on the increasing shift to production phases for offshore oil fields.
-Research Report by DBS Group Research (20 Aug)
Labels:
BakerTech,
CH Offshore,
Cosco,
Research Reports,
SembMarine,
STX Pan Ocean,
Yangzijiang
Saturday, August 23, 2008
Cosco 220808
Cosco has lost about a third of its value since the beginning of August. After testing the long term downtrend support (low pink) on 19 aug, Cosco recovered a little and seems to have found temporary support around the 2.10 level.
However, Cosco also seems to have some trouble breaking the downtrend resistance (low red). We could see Cosco trading sideways next week, with some action later in the week when both the downtrend resistances (low red, mid pink) meet.
For monday :
Support @ 2.08, 2.00, 1.91 (low pink)
Resistance @ 2.15 (low red), 2.195 (mid pink), 2.32 (mid red), 2.45 (blue ...)
China HongX 220808
After testing the 0.350 level thrice this week, China Hongxing managed to trade above the 0.355 support (pink ...). However, we still see China Hongxing unable to break the 0.375 resistance (lightblue ...).
We could be looking at China Hongxing trading sideways between the 0.375 resistance (lightblue ...) and 0.355 support (pink ...). We could also see some action towards the end of next week when the 1st long term downtrend resistance (mid grey) meets the 0.375 resistance.
For monday :
Support @ 0.355 (low grey, pink ...), 0.330 (upp red), 0.310 (low red)
Resistance @ 0.375 (lightblue ...), 0.395 (mid grey), 0.405 (lightblue --), 0.425 (red ...)
BakerTech 220808
BakerTech recovered a little after the Doji formed on 19 aug. However, this rebound could be short-lived as we see Baker Tech still unable to break the 1st long term downtrend resistance (mid red).
BakerTech also seems to have found some temporary support @ the 0.185 level. However, as mentioned previously on 19 aug, we could still see BakerTech testing the 0.160 support (pink --) if the 1st long term downtrend resistance (mid red) is not broken by next week.
For monday :
Support @ 0.185 (pink --), 0.164 (low red)
Resistance 0.1965 (mid red), 0.225 (pink ...), 0.235
Tuesday, August 19, 2008
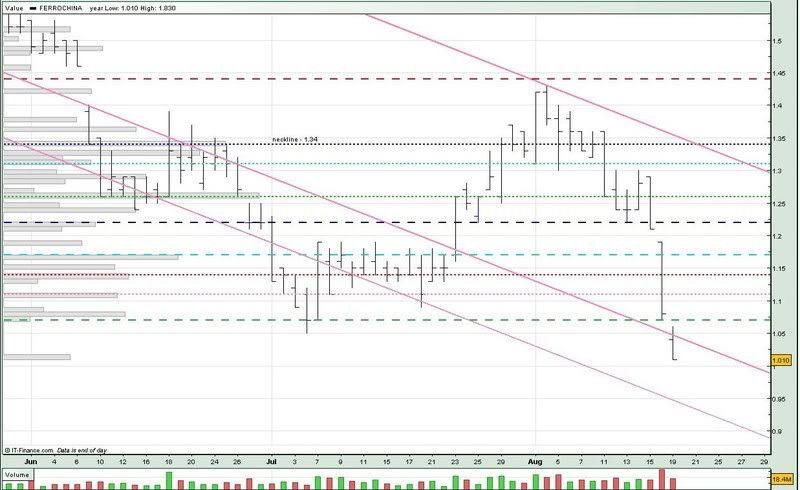
Ferro China 190808
Ferro China today gapped down and broke the 1.07 support (green --). It closed at 1.01, which is the price it hit back on 1 feb, which Ferro China then went on a fierce and steep rebound.
Would it be the same this time ?
For that to happen, we would first need FerroChina to recover above the long term downtrend support (mid pink) and the 1.07 support (green --), and stay above these 2 supports.
Otherwise, we might see Ferro China gradually heading towards the 0.90 level as indicated by the long term downtrend support (low pink).
For tomorrow :
Support @ 1.01, 0.940 (low pink)
Resistance @ 1.04 (mid pink), 1.07 (green --), 1.11 (pink ...), 1.14 (red ...)
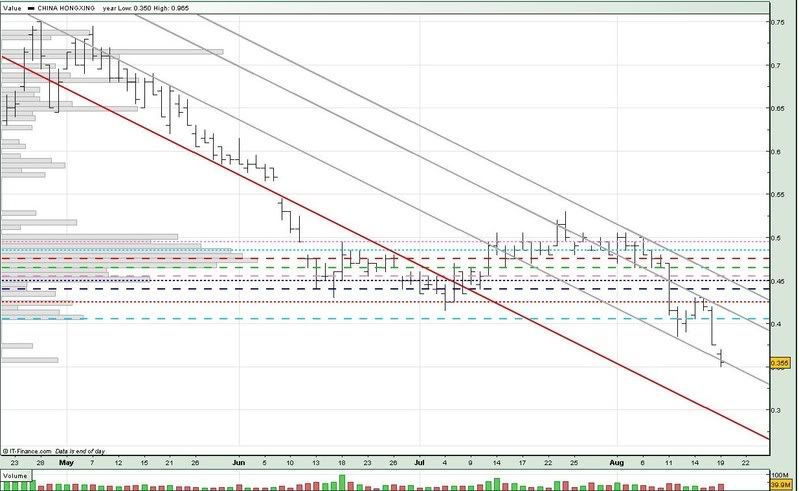
China HongX 190808
After failing to break the long term downtrend resistance (mid grey), China Hongxing has now weakend considerably and has now broken the 0.405 support (lightblue --). China Hongxing also closed below the long term downtrend support (low grey) today.
The last time China Hongxing was trading around the 0.350 level was way back in nov 2006. If China Hongxing doesn't rebound or recover above the downtrend support (low grey) soon, we could see it testing the next support (low red).
For tomorrow :
Support @ 0.350, 0.300, 0.2882 (red)
Resistance @ 0.375, 0.405 (lightblue --), 0.415 (mid grey), 0.425 (red ...)
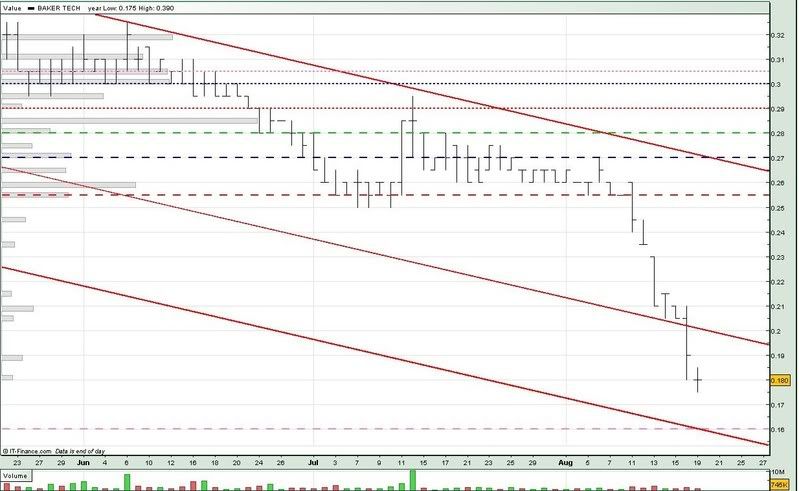
BakerTech 190808
The reversal indicator did not materialise, instead, we saw Baker Tech breaking the 1st long term downtrend support (mid red) the day after (16 aug). Although BakerTech formed a Doji today, but I feel this would only be a slight reprieve.
We could be looking at Baker Tech heading eventually for the 0.160 support (pink --) before there's any significant rebound.
For tomorrow :
Support @ 0.180, 0.160 (pink --), 0.159 (low red)
Resistance @ 0.180, 0.200 (mid red), 0.215
We could be looking at Baker Tech heading eventually for the 0.160 support (pink --) before there's any significant rebound.
For tomorrow :
Support @ 0.180, 0.160 (pink --), 0.159 (low red)
Resistance @ 0.180, 0.200 (mid red), 0.215
Saturday, August 16, 2008
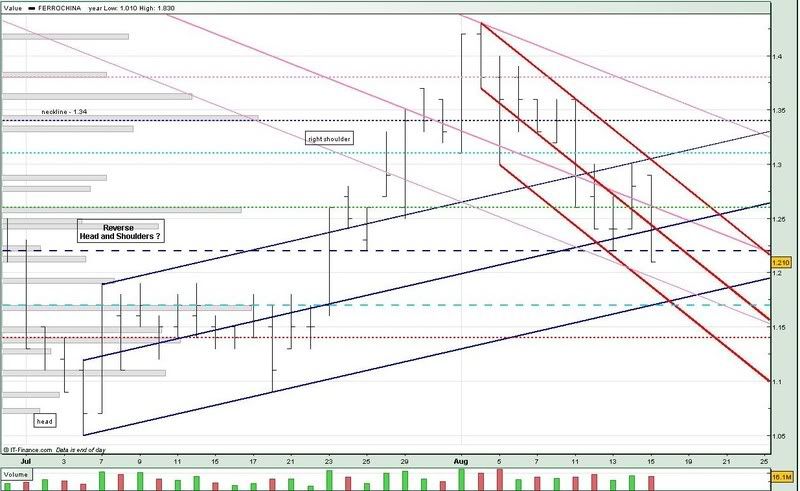
Ferro China 150808
After our last discussion, Ferro China's 1.31 support (lightblue ...) broke at the beginning of the week, and FerroChina never came close to testing it again. Ferro China even broke the 1.26 support (green ...) and 1.22 support (blue --) today.
If Ferro China fails to hold onto the long term downtrend support (low pink), we could be looking at the 1.17 support (lightblue --) being tested next week.
However, if FerroChina manages to trade above the 1.22 support (blue --), we could see it trading sideways, with 1.26 being the resistance (green ...).
For monday :
Support @ 1.19 (low pink), 1.174 (low red, low blue), 1.17 (blue --), 1.14 (red ...)
Resistance @ 1.22 (blue --), 1.23 (mid red), 1.243 (mid blue), 1.255 (mid pink), 1.26 (green ...)
Friday, August 15, 2008
Indofood Agri Research Report
by CIMB-GK (15 Aug)
H1 2008 core net profit (excluding biological gains) of 882 billion rupiah (S$135 million) accounts for 60 per cent of our full-year estimate and 46 per cent of consensus. We consider the results to be in line with our expectation but below consensus.
This is because we expect a weaker H2 from lower crude palm oil (CPO) selling prices and higher fertiliser costs. As expected, the group did not declare any interim dividend.
Key surprises in Q2: Both cooking oils and fats and commodities performed above expectations due to better-than-expected sales volume and profit margins. The group gained market share in the branded cooking oil segment as well as benefited from the rapid growth of supermarket chains in Indonesia. Commodities posted stronger earnings thanks to higher processing volume and more timely purchases of raw materials.
All divisions turned in higher earnings. Q2 2008 core net profit grew 51 per cent y-o-y, thanks to higher selling prices, better earnings from its downstream divisions as well as additional contributions from London Sumatra. To recap, the group started consolidating LonSum's results from Nov 1, 2007. Core net profit fell 37 per cent q-o-q due to a higher effective tax rate and higher minority interests.
Raising FY2008-10 EPS forecasts by 3-6 per cent. We have raised our earnings estimates by 3-6 per cent for FY2008-10 to account for the better contributions from cooking oils & fats and commodities. Our new forecasts assume lower earnings in H2 2008 due to weaker CPO prices and higher estate costs.
Our target price has been raised after our earnings revisions, still based on 10x forward PE. The share price has corrected by 34 per cent in the last month. As such, it now offers 19 per cent upside to our revised target price, which is in line with expected market returns, coupled with the better performances from its downstream units.
-Research Report by CIMB-GK (15 Aug)
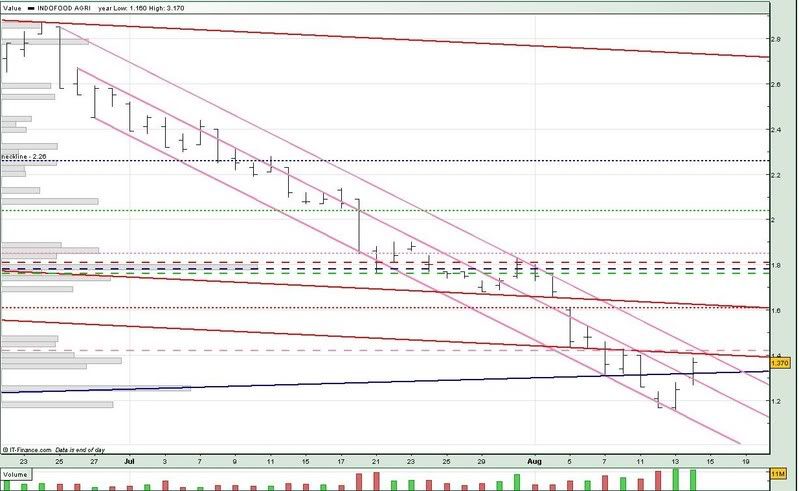
Indofood Agri 140808
After testing the 2nd downtrend support (low pink) yesterday, Indofood Agri recovered today to break the downtrend resistance (mid pink) and uptrend support (blue).
As you can see from the chart, Indofood Agri is now trading quite near to the 1.42 resistance (pink --). And we also have the downtrend resistance (upp pink), meeting the long term downtrend resistance (low red) near the 1.40 level. So we might see Indofood Agri softening a little once it hits that level.
For tomorrow :
Support @ 1.326 (blue), 1.258 (mid pink), 1.07 (low pink)
Resistance @ 1.40 (upp pink, low red), 1.42 (pink --), 1.48, 1.61 (upp red, red ...)
Thursday, August 14, 2008
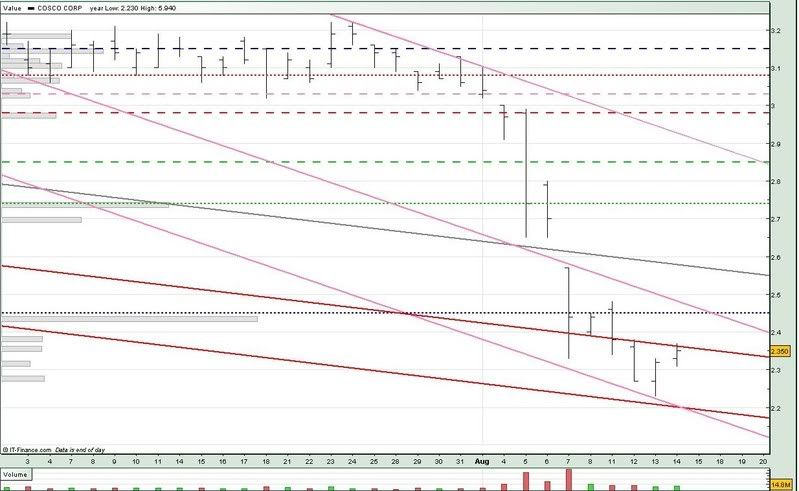
Cosco 140808
After failing to break the 2.45 resistance (blue ...) on 11 aug, Cosco is now trading below downtrend resistance (upp red), and still within the long term downtrend channel (pink).
If Cosco continues to weaken, we could see Cosco testing the long term downtrend support (low pink).
For tomorrow :
Support @ 2.27, 2.19 (low red), 2.18 (low pink)
Resistance @ 2.35 (upp red), 2.45 (blue ...), 2.46 (mid pink), 2.57 (grey), 2.74 (green ...)
If Cosco continues to weaken, we could see Cosco testing the long term downtrend support (low pink).
For tomorrow :
Support @ 2.27, 2.19 (low red), 2.18 (low pink)
Resistance @ 2.35 (upp red), 2.45 (blue ...), 2.46 (mid pink), 2.57 (grey), 2.74 (green ...)
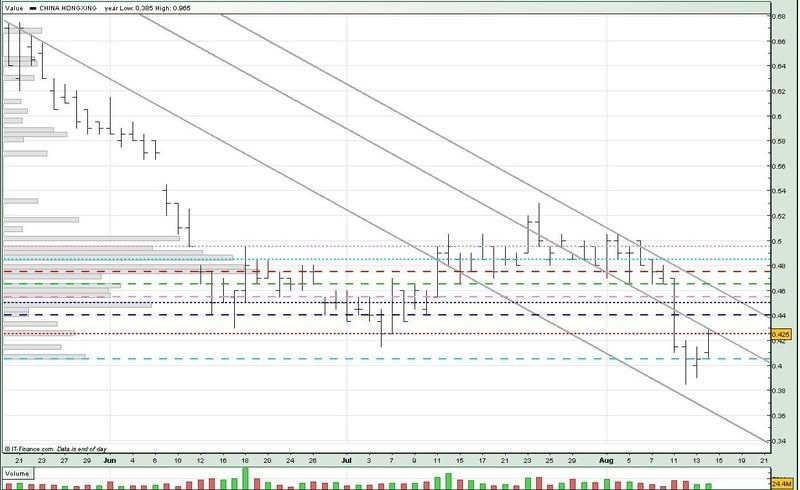
China HongX 140808
China Hongxing's fate took a dramatic turn for the worse at the beginning of the week, breaking several supports along the way, before closing at the 4 jul low of 0.415. It also seems to have found temporary support at 0.405 (lightblue --).
China Hongxing's recovery has also been limited by the downtrend resistance (mid grey) and 0.425 resistance (red ...). We could be looking at a double-bottom for China Hongxing, but it would first have to break the 0.440 resistance (blue --).
For tomorrow :
Support @ 0.405 (light blue --), 0.360 (low grey)
Resistance @ 0.425 (mid grey, red ...), 0.440 (blue --), 0.450 (blue ...), 0.455 (pink --)
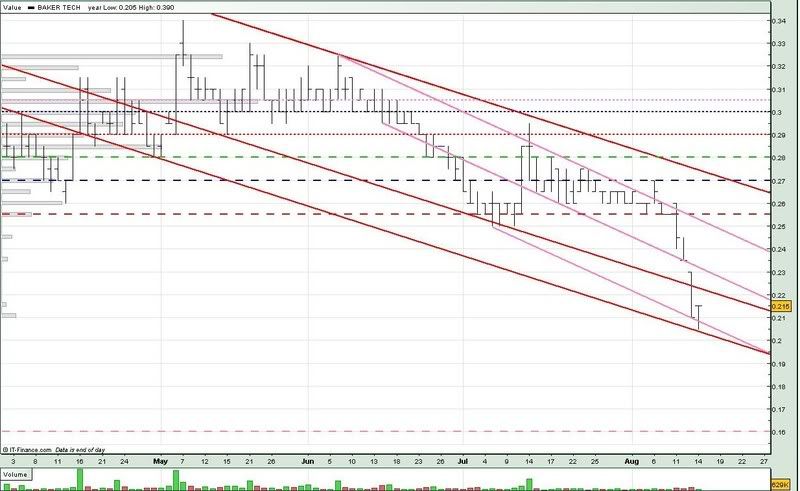
BakerTech 140808
The last time BakerTech hit around the 0.205 level was way back in early april 2007. That was when Baker Tech broke out from around the 0.150 level.
After forming the Gravestone Doji on 12 aug, BakerTech gapped down the next day and broke the 1st downtrend support (mid pink) and 1st long term downtrend support (mid red).
Although BakerTech came to within a whisker of testing the 2nd long term downtrend support (low red), it manage to recover and close the day at the opening price, forming a Dragonfly Doji.
As mentioned before, to confirm a trend reversal, we would need Baker Tech to either gap up tomorrow, or at least close higher.
However, if it breaks the long term downtrend support (low red), we may see it heading for the 0.160 support (pink --), which is from where it broke out back in april 2007.
For tomorrow :
Support @ 0.206 (low pink), 0.203 (low red), 0.160 (pink --)
Resistance @ 0.215, 0.222 (mid red), 0.230 (mid pink), 0.235
Yangzijiang Research Report
by DBS GROUP (13 Aug)
MARGIN pressure more apparent: Yangzijiang's Q2 2008 net profit surged 132 per cent y-o-y to 338.2 million yuan (S$69.3 million) on 249 per cent higher sales, as margins disappointed. Gross margin fell 13.5 percentage points (ppt) y-o-y and 3.8 ppt q-o-q to 17.2 per cent, compared with our expectation of 20 per cent.
The negative impact of rising steel prices and the rising yuan against the US dollar has apparently hit Yangzijiang's gross margin earlier than expected, as it executed on projects that were secured in 2006 at much lower contract prices.
As a recap, while we have argued in earlier reports that margins for individual projects commencing April will be hit, the negative impact on the group's margins may only be more apparent in H2 2008.
Yangzijiang's gross margins should remain under pressure in H2 2008, as both steel prices and the currency continue to be significantly higher versus late Q4 2007. Indeed, we expect the prices for new steel plates supply for projects commencing in July 2008 to be about 10 per cent higher than those in Q2 2008.
But this could be mitigated by: contribution from two high-margin vessels with improved efficiency; the deployment of larger and higher-margin vessels, eg 92.5k bulkers; and the execution of better-priced contracts signed in 2007.
Still, we cut our gross margin assumptions for FY2008 and FY2009, and earnings estimates by 6 per cent and 10 per cent to 1.409 billion yuan and 1.701 billion yuan respectively.
While we believe Yangzijiang is pro-active in currency hedging and adopting margin enhancement measures, the execution of its record high order backlog remains a concern. Reduced TP based on a lower PE multiple of eight times (versus 14 times previously) on revised FY2009 forecast earnings.
This is in line with the de-rating of China-listed shipyards, where prices fell recently due to concerns of rising steel prices and currency, as well as order cancellations.
-Research Report by DBS GROUP (13 Aug)
Sunday, August 10, 2008
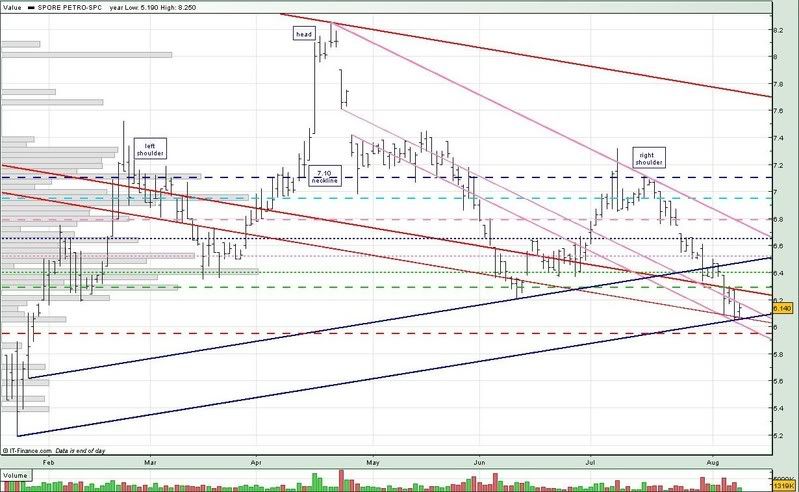
SPC 080808
After hitting the 7.10 neckline (blue --) and downtrend resistance (upp pink) on 15 jul, SPC has softened considerably and has now broken the 6.40 support (green ...). From the chart, we can also see that SPC has formed the Head & Shoulders formation.
Taking the peak of 8.25 on 21 apr, we calculated the diffrence with the 7.10 neckline to be 1.15. So we might be looking at SPC to hit a low of about 5.95 (7.10 - 1.15), or thereabouts.
For monday :
Support @ 6.06 (low blue, low red), 6.00 (low pink)
Resistance @ 6.153 (mid pink), 6.264 (mid red), 6.29 (green --), 6.40 (green ...), 6.475 (upp blue)
Semb Marine 080808
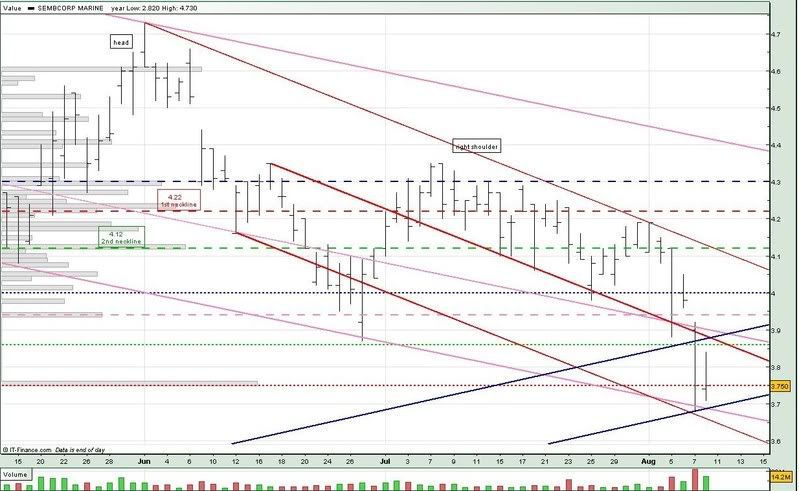
What a difference a week makes ! Last week, we were still analysing if Sembcorp Marine can test the 4.22 neckline (red --). This week, Sembcorp Marine capitulated and is currently trading near the 3.75 support (red ...), which is roughly the difference (4.73 - 4.22 = 0.51) taken from the 4.22 neckline.
I've indicated 3.75 as the support as most of the trades were done there based on the volume distribution bar. The next support will be taken from the 4.12 neckline (green --) which is (4.73 - 4.12 = 0.61). So we could be looking at 3.51 being the next support (pink ...).
If you look at Sembcorp Marine's past trading patterns, its sharp plunges are usually followed by equally sharp recoveries.
For monday :
Support @ 3.75 (red ...), 3.69 (low blue), 3.68 (low pink), 3.65 (low red)
Resistance @ 3.86 (green ...), 3.87 (mid red), 3.88 (upp blue), 3.90 (mid pink), 3.94 (pink --), 4.00 (blue ...)
Saturday, August 9, 2008
Indofood Agri 080808
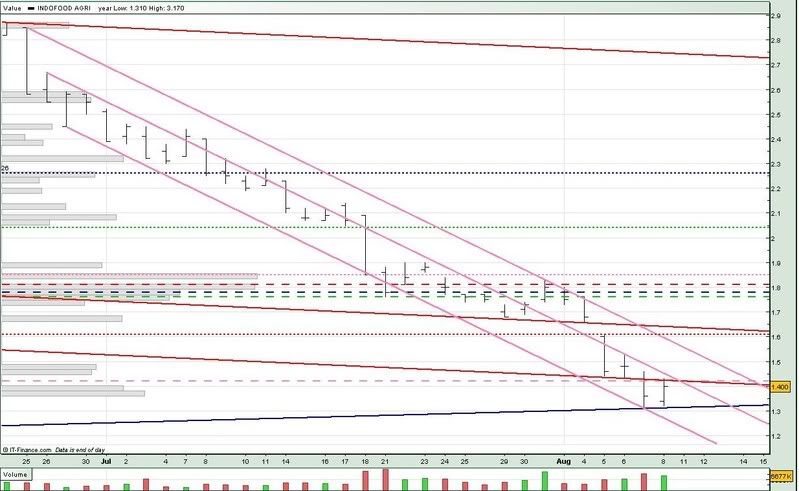
After breaking the 1.42 support (pink --) on 7 aug, Indofood Agri seems to have found temporary support along the uptrend support (blue). As discussed previously, although Indofood Agri has now broken the 1.74 neckline, it won't be a straight path down (that's if it really does).
So we might be seeing Indofood Agri trading sideways for the time being. As you can see from the chart, the 1st downtrend resistance (mid pink) meets the uptrend support (blue) sometime next week. So we might see some action towards the end of next week.
For monday :
Support @ 1.31 (blue), 1.23 (low pink)
Resistance @ 1.42 (mid pink, low red, pink --), 1.556 (upp pink), 1.61 (red ...)
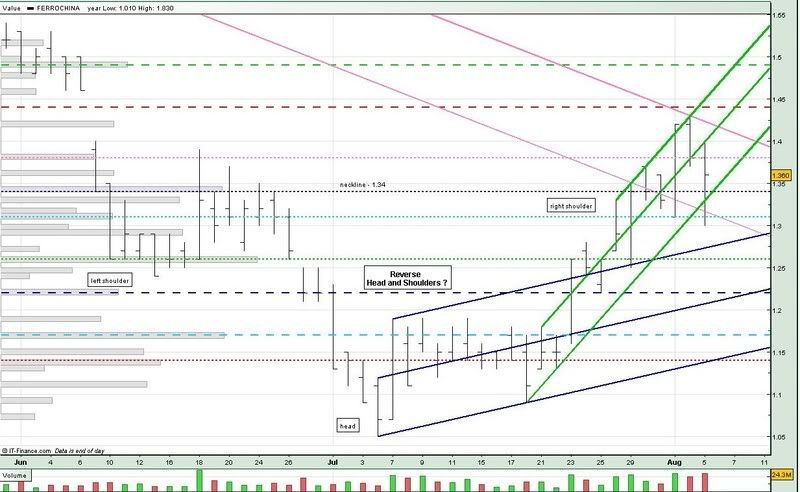
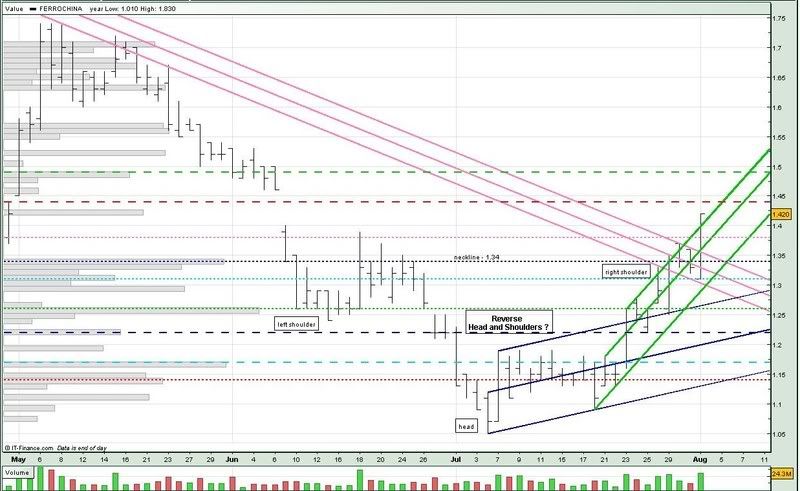
Ferro China 080808
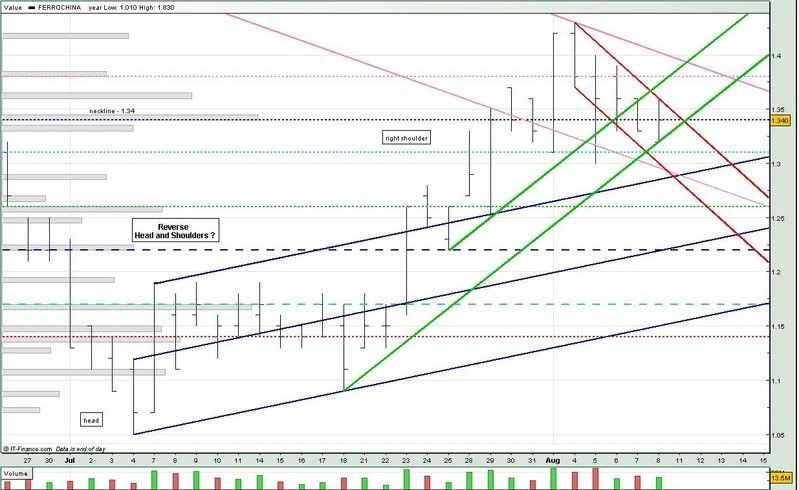
Although Ferro China broke the 1.34 neckline on 1 aug, it did not quite reach the same peak it did back in may. It also seems more likely FerroChina could have peaked, as its highs have been lower since the beginning of the week.
Since Ferro China still has not tested the 1.31 support (lightblue ...), there could still be a chance that it is going through a profit-taking phase.
However, we can also see from the chart that the downtrend resistance (upp red) meets the uptrend support (low green) at the 1.34 neckline (blue ...) next week. So next week could be crucial for FerroChina.
If Ferro China can stay above 1.34, we could see it trading sideways before attempting to test the 1.38 (pink ...) resistance.
Otherwise, the 1.31 support (lightblue ...) could be in for some severe test.
For monday :
Support @ 1.34 (blue ...), 1.33 (low green), 1.31 (llightblue ...), 1.29 (low pink, upp blue), 1.28 (low red)
Resistance @ 1.344 (upp red), 1.38 (pink ...), 1.388 (upp green), 1.395 (upp pink)
Cosco 080808
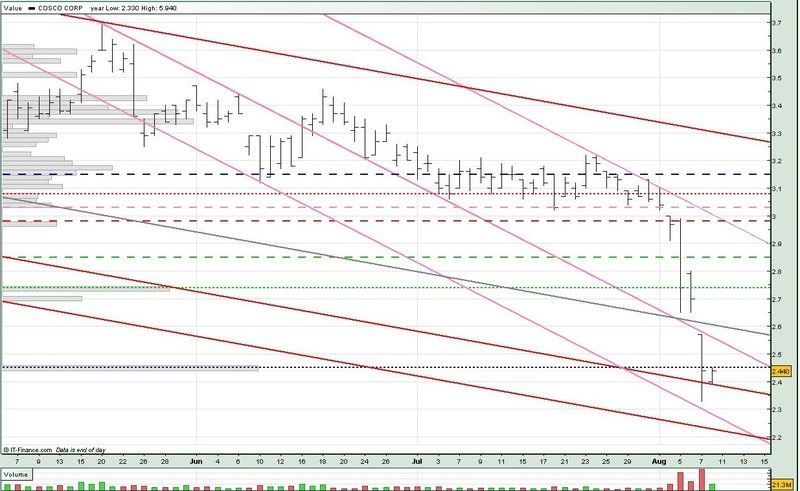
The last time Cosco plunged to the 2.3+ level was way back on 28 feb 2007, when it gapped down on opening on a low 2.32, and closed stongly at 2.75. However, things are alot different today.
Yesterday, Cosco gapped down too, but it plunged further to 2.33 before closing just below the 2.45 resistance (blue ...). Today was just a little better as in Cosco did not revisit the 2.33 low, but still close below the 2.45 resistance .
Things have taken a dramatic turn for the worse since 1 aug and Cosco has broken many important supports. It would most likely be quite awhile before we see Cosco recover to the 1 aug levels.
For monday :
Support @ 2.38 (mid red), 2.258 (low pink), 2.22 (low red)
Resistance @ 2.45 (blue ...), 2.55 (mid pink), 2.60 (grey), 2.74 (green ...)
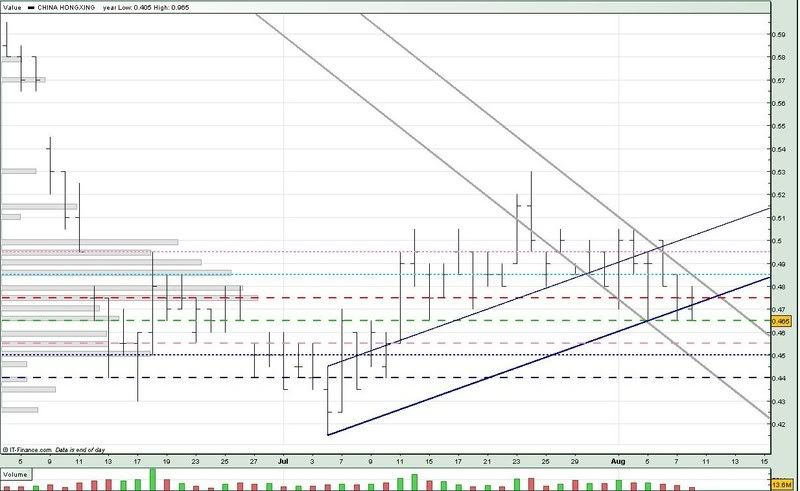
China HongX 080808
Today is the third time China Hongxing tested the 0.465 support (green --) since 5 aug. It also broke the uptrend support (low blue) today.
What this means is that there is now a greater chance that China Hongxing might break the 0.465 support.
We can also see from the chart that the long term downtrend resistance (upp grey) converging with the uptrend support (low blue) at the 0.475 resistance (red --) around 12 aug. So we might see some action for China Hongxing next week provided the 0.465 support still holds.
If the support breaks, we could even see China Hongxing testing the 0.450 support (blue ...)
For monday :
Support @ 0.465 (green --), 0.455 (pink --), 0.450 (blue ...), 0.444 (low grey), 0.440 (blue --)
Resistance @ 0.473 (low blue), 0.475 (red --), 0.4805 (upp grey), 0.485 (lightblue ...)
Thursday, August 7, 2008
Semb Marine Research Report
by OCBC Investment Research (6 Aug)
SEMBCORP Marine (SMM) has reported an expectedly strong set of Q2 2008 results with the top line growing 32 per cent y-o-y to $1.386 billion, while the bottom line rose 51 per cent to $128.2 million. Rig building was its star performer, with sales rising 54 per cent y-o-y to $861 million. Should contracts with favourable clauses continue to be awarded, we are optimistic that SMM will be able to register a year of contract wins similar to FY2007.
Margins continue to surprise on the upside. SMM's margins have registered an improvement again and we think that it is due to a confluence of factors:
More projects coming into the work in progress phase and incurring initial 20 per cent recognition;
Repeated orders for the same rig design resulting in improved efficiencies; and
Effective steel price hedging with its suppliers.
However, relative to the current rig orders that are secured, we currently forecast that 2009 may be SMM's peak earnings year. Notwithstanding a collapse of oil price or extraordinary price hikes in raw material/equipment, SMM must continue to win orders from oil majors and national oil companies to provide firmer growth visibility past 2010.
A change in product mix from drilling equipment to non-drilling/production equipment and a ramp-up in ship repair will also support SMM's earnings.
On yard space, we believe that the main constraint is not full utilisation of its yard space, but the possible delays in equipment like drilling packages and onboard motors that have been in tight supply.
The bumper crop in rig orders in 2007 and 2008 will translate to a strong showing in the bottom line. If SMM continues its historical 70 per cent payout ratio, we anticipate a two-fold jump in dividends in FY2008.
For H1 2008, SMM declared dividends of $0.05 per share. SMM is a pure-play O&G manufacturer and its premium sum-of-the-parts valuation is geared to capture its earnings potential backed by on-time and on-budget deliveries, unlike new entrants into this field. Our FY2010 estimates will change with stronger order book visibility.
-Research Report by OCBC Investment Research (6 Aug)
Wednesday, August 6, 2008
Cosco Research Report
by JP Morgan (5 Aug)
Q2 2008 results in line: Cosco posted H1 2008 net profit of $213 million (+74 per cent y-o-y), driven largely by its strong order backlog of $7.4 billion. Q2 2008 profit after tax and minority interests (Patmi) was $129 million (+60 per cent y-o-y, +53 per cent q-o-q). However, management has not provided any profit breakdown for the three divisions.
Steel price concern remains: Cosco experienced about a 28 per cent increase in steel prices YTD. It secured the steel requirement for the 10 dry bulk carriers for FY2008 delivery and 20 of the 40 for FY2009 at about 6,200 yuan (S$1,246) per ton.
Cosco hopes to secure the remaining steel requirements for the next 20 dry bulk carriers for FY2009 at slightly below 7,000 yuan per ton, which will still surpass the extra 20 per cent steel price buffer.
Given the continued tight supply and cost push pressures facing steel mills, we do not expect prices to weaken substantially despite the recent global slowdown.
Changes to earnings estimate: As confirmed by management, current steel prices have eroded their 20 per cent built-in steel price increase buffer. Based on the steel price trend over the past 12 months and management guidance of 6,200 yuan per ton for its existing steel inventory and potentially 7,000 yuan per ton for H2 2009 requirements, the newbuilding net profit assumption is likely to be between 5.8 and 7 per cent.
We reduce our margin assumption for the dry bulk carriers from 10 per cent to 6 per cent, and hence decrease our Patmi estimates for FY2009 by 9 per cent and for FY2010 by 12 per cent.
The lack of earnings transparency adds another layer of uncertainty, given the lack of visibility already on steel price inputs. We also do not see any major price catalysts in terms of contract momentum, as management is taking a more cautious approach towards filling their orderbook, although the six options from Sevan are widely known.
Key risks to our price target include a decline in steel prices and a substantial acceleration in the orderbook.
-Research Report by JP Morgan (5 Aug)
Tuesday, August 5, 2008
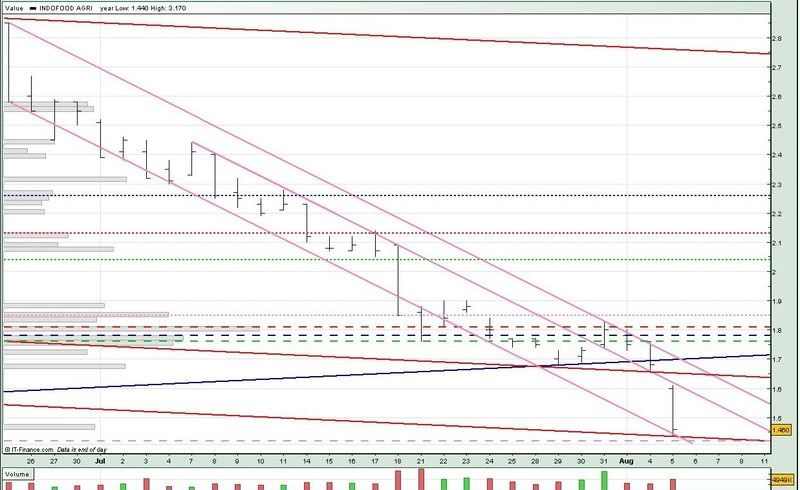
Indofood Agri 050808
Indofood Agri broke the uptrend support (low blue) and also the 1.74 neckline yesterday (4 aug). It also gapped down and tested the downtrend support (low pink). As discussed on 25 jul, we could see Indofood Agri retreating all the way till the 1.20 price levels (which is about 1.74 - 0.52).
However, it would most probably not be a straight plunge downwards. We could see Indofood Agri trade sideways first, or making a gradual downward trend towards the 1.20 price levels.
For tomorrow :
Support @ 1.43 (low red), 1.42 (pink --), 1.403 (low pink)
Resistance @ 1.585 (mid pink), 1.65 (mid red), 1.70 (upp pink, blue), 1.74, 1.76 (green --)
Ferro China 050808
Although FerroChina tested the 1.34 (blue ...) and 1.31 (light blue ...) supports today, as well as the long term downtrend support (low pink), and uptrend support (low green), Ferro China managed to recover and close above all those supports which it tested.
So, is Ferro China taking a breather, or has it peaked already?
If FerroChina opens above the 1.34 support (blue ...) tomorrow, I think it would at most test the long term downtrend resistance.
If Ferro China opens below the 1.34 support, we may see it testing the 1.26 support (green ...)
For tomorrow :
Support @ 1.347 (low green), 1.34 (blue ...), 1.31 (low pink, lightblue ...), 1.276 (upp blue), 1.26 (green ...), 1.22 (blue --)
Resistance @ 1.38 (pink ...), 1.42 (mid green, upp pink), 1.44 (red --)1.47 (upp green)
Cosco 050808
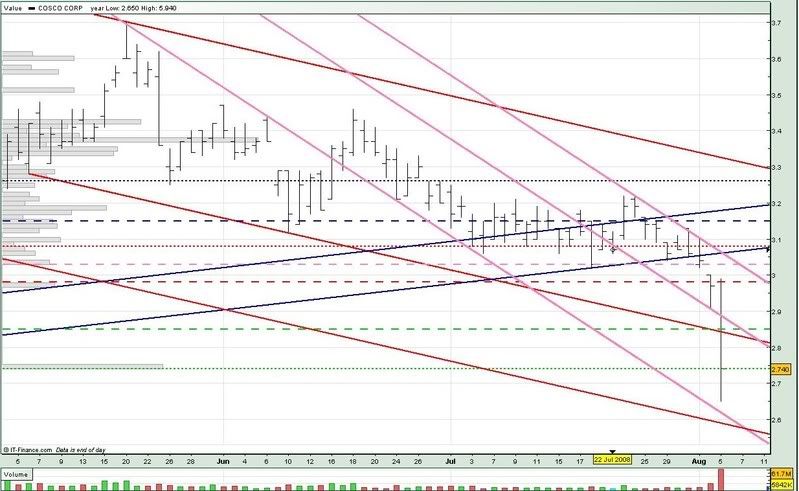
The last time we saw Cosco taking such a dramatic plunge was on 10 apr this year, together with what was probably a record volume transacted. Today's plunge was almost equal in price difference but volume was less than half.
Where do we go from here ? Will history repeat itself ? Nobody really knows as the conditions now may not be the same as in april. But as they say, history usually repeats itself as there will always be some sort of cycles. So, we can only rely on trendlines. But how would we know which ones are accurate or reliable ?
There's no sure win formula to draw a 'correct' trendline. Only time and experience will tell. Main thing is you need to be nimble and spot the correct one out of the many you've drawn. It also helps if you keep a record of the trendlines you've drawn. That's why I put it down on my blog, so that I can go back and see my own analysis.
Cosco broke the 1st long term downtrend support (mid pink) today. It also broke the 2.85 support (green --), which was the low it hit on 17 mar. Cosco almost hit the 2nd long term downtrend support (low pink) before recovering slightly to close right on the 2.74 volume support (green ...). Actually, the support is from 2.74 to 2.75 as most of the volume was done around this region.
If Cosco opens above this support (green ...) tomorrow, we could have a rebound, which will probably be a small one, with the upside limited by the 2.85 support-turned-resistance (green --).
If Cosco opens below the 2.74 support (green ...), we could see it hit today's low of 2.65 again.
For tomorrow :
Support @ 2.74, 2.65, 2.60 (low pink), 2.58 (low red)
Resistance @ 2.83 (mid red), 2.85 (green --), 2.87 (mid pink), 2.98 (red --), 3.03 (pink --)
China HongX 050808
China Hongxing went on a roller-coaster ride today - not only breaking 2 crucial supports (0.485 & 0.475), and testing the uptrend support (low blue) as well as the long term downtrend support (low grey). We then saw China Hongxing staging an equally dramatic recovery to close above the supports again.
Also important to note is that China Hongxing still could not break the 0.495 resistance (pink ...), which is also the long term downtrend resistance (upp grey).
We could be seeing China Hongxing attempting to break the 0.495 resistance again tomorrow. If it still doesn't break it, we could see China Hongxing repeating todays trading pattern. But this time, there may not be such a strong recovery later in the day.
For tomorrow :
Support @ 0.485 (lightblue ...), 0.478 (low blue), 0.475 (red --), 0.460 (low grey, green --), 0.450 (blue ...), 0.440 (blue --)
Resistance @ 0.495 (upp grey, pink ...), 0.5075 (upp blue), 0.515 (pink --), 0.535
BakerTech 050808
Since the last time we analyse BakerTech on 17 jul, it continues to trade within the downtrend. However, Baker Tech formed a Bullish Dragonfly Doji today, which usually occurs at the bottom of a trend, or during a downtrend, which is what is happening to BakerTech currently. BakerTech also hit the 0.255 support (red --).
Don't get too excited. We would need a confirmation tomorrow to confirm a trend reversal. Ideally, we would need Baker Tech to gap up and break the downtrend resistance (upp pink). If not, at least close higher than today's closing price (0.260).
For tomorrow :
Support @ 0.255 (red --), 0.2525 (low blue), 0.250 (low pink)
Resistance @ 0.262 (upp pink), 0.267 (upp blue), 0.270 (blue --), 0.280 (upp red, green --)
Cosco Q2 profit up 60% to $128.7m
Turnover doubles to $1.05b; first time it reports quarterly revenue above $1b
By VINCENT WEE
COSCO Corp (Singapore) continued its good form in the second quarter, with a 60 per cent year-on-year rise in profit to $128.7 million on a doubling of turnover to $1.05 billion from $512.3 million. It was also the first time that the group reported quarterly revenue of more than $1 billion.
First-half turnover also doubled - to $1.76 billion from $868.1 million. And profit rose 74 per cent to $212.6 million.
Growth was good across all business segments and benefited from the expansion of Cosco's facilities and resulting increased capacity. In the dominant (93 per cent) ship repair, shipbuilding and marine engineering business, turnover rose 112 per cent to $978.2 million, while the dry bulk shipping business saw steady 38 per cent growth to $61.1 million. Earnings per share rose from 3.60 cents to 5.75 cents.
'Our growing order book is well-supported by our continuing efforts to expand our capacity,' said vice-chairman and president Ji Hai Sheng. 'Our joint venture with the Port Authority of Lianyungang, Jiangsu has contributed positively to shiprepair and conversion earnings since Q2FY08. We also look forward to a further increase in contributions from our two new Zhoushan dry docks with total capacity of 380,000 dwt as they begin their first full-year contributions in FY2008.'
Mr Ji reassured investors that there have been no order cancellations and is confident that there will not be any as Cosco's customers are reputable
Sunday, August 3, 2008
Olam 010808
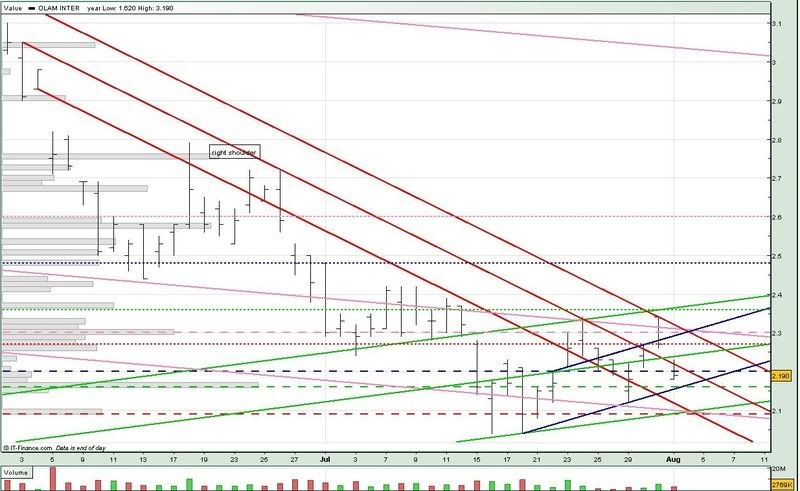
After hitting a low of 2.04 on 18 jul, Olam seemed to have recovered somewhat, although it is recently trading quite erratically. Olam may have negated the Head & Shoulders formation by not dropping below, or testing the 2.09 support (red --) till date.
Having said that, we still could not see a clear trend for Olam as yet. Unless Olam breaks the downtrend resistance (upp red), we could continue to see Olam trading sideways between the 2.16 support (green --) and 2.27 resistance (red ...) for the time being.
For monday :
Support @ 2.16 (low blue, green --), 2.10 (low red), 2.096 (low pink, low green), 2.09 (green --)
Resistance @ 2.20 (blue --), 2.205 (mid red), 2.24 (mid green), 2.27 (red ...), 2.30 (upp blue, pink --), 2.308 (upp red, mid pink)
Saturday, August 2, 2008
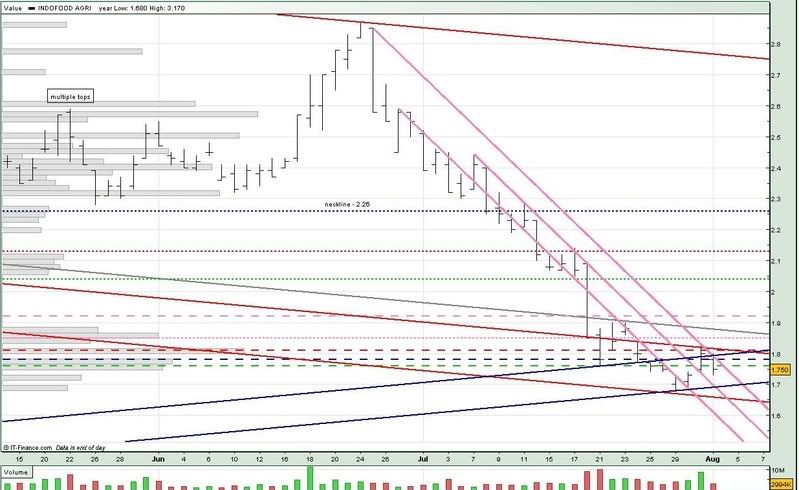
Indofood Agri 010808
After hitting a low of 1.68 (22 jan low - 1.70) on 29 jul, Indofood Agri recovered a little and seems to have found some support back at the 1.74 level. However, it also seems that Indofood Agri is finding it abit diffcult to break through the many resistant levels (1.76, 1.78, and 1.81).
We could see Indofood Agri try to find a base around the 1.74 level for the time being, before attempting to break through again.
For monday :
Support @ 1.74, 1.69 (low blue), 1.66 (mid pink, low red), 1.57 (low pink)
Resistance @ 1.76 (upp pink, green --), 1.78 (blue --), 1.81 (upp red, red --), 1.85 (pink ...), 1.87 (grey), 1.92 (pink --)
Ferro China 010808
Ferro China broke the 1.34 neckline (blue ...) on the 3rd try. Furthermore, FerroChina also broke the long term downtrend resistance (upp pink), 1.38 resistance (pink ...) and uptrend resistance (upp green). The breakout was also accompanied with high volume.
We could be seeing a potential explosion for Ferro China to it high during May. However, FerroChina is also now trading very near to the 1.44 resistance (red --), which is from where it gapped down on 9 jun.
If Ferro China stays above the 1.38 level (pink ...), we could see it testing the 1.44 resistance next week. Or we could be seeing it trade sideways between the 1.38 (blue ...) and 1.34 (lightblue ...) levels.
If Ferro China breaks the 1.34 support, we could see it trading sideways between the 1.26 support (green ...) and 1.34 level.
For monday :
Support @ 1.415 (upp green), 1.38 (mid green, pink ...), 1.35 (upp pink), 1.32 (mid pink), 1.31 (low green, lightblue ...), 1.295 (low pink), 1.269 (upp blue), 1.26 (green ...)
Resistance @ 1.42, 1.44 (red --), 1.49 (green --)
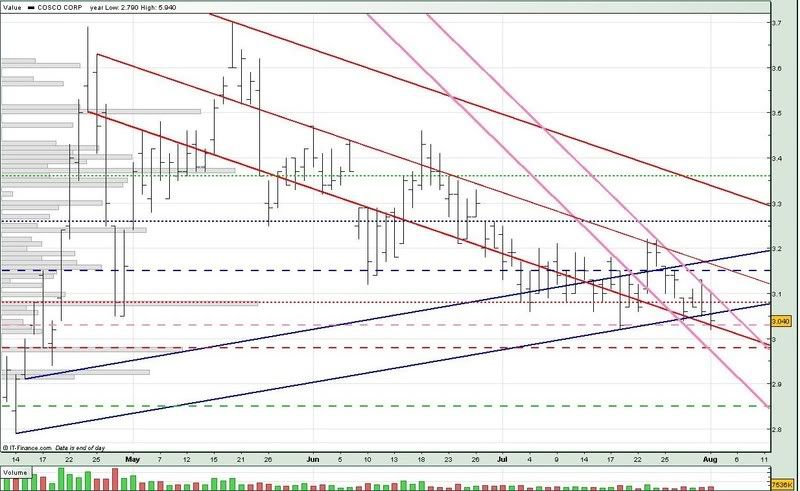
Cosco 010808
After breaking the 3.08 suppport (red ...) on 29 jul, Cosco continues to trade within the long term downtrend channel (pink). Cosco also broke the uptrend support (low blue) and tested the downtrend support (low red) and 3.03 support (pink --).
The last time Cosco tested the 3.03 support was on 18 jul, and it staged a mini recovery after that. Would it be the same this time?
We could see some action for Cosco next week as the long term downtrend resistance (upp pink) meets the uptrend support (low blue) at the 3.06 level.
If Cosco doesn't break the long term downtrend resistance (upp pink) by next week, I believe the 3.03 support could even be broken. And if that happens, we could see Cosco testing the long term downtrend support (low pink).
If the 3.03 support holds, we could see Cosco trading sideways between the 3.03 support and 3.08 resistance. And if Cosco breaks the 3.08 resistance convincingly, we could see it testing the 3.15 resistance (blue --).
For monday :
Support @ 3.03 (pink --), 3.02 (low red), 2.98 (red --), 2.96 (low pink), 2.85 (green --)
Resistance @ 3.06 (low blue), 3.08 (red ...), 3.09 (upp pink), 3.15 (blue --)
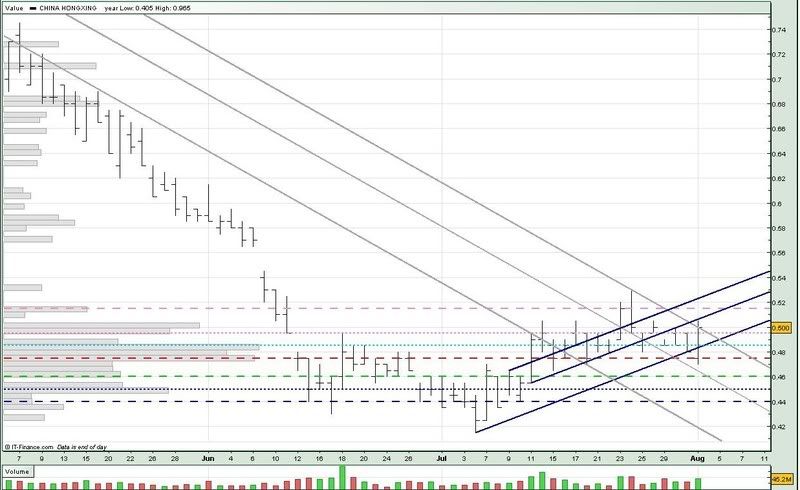
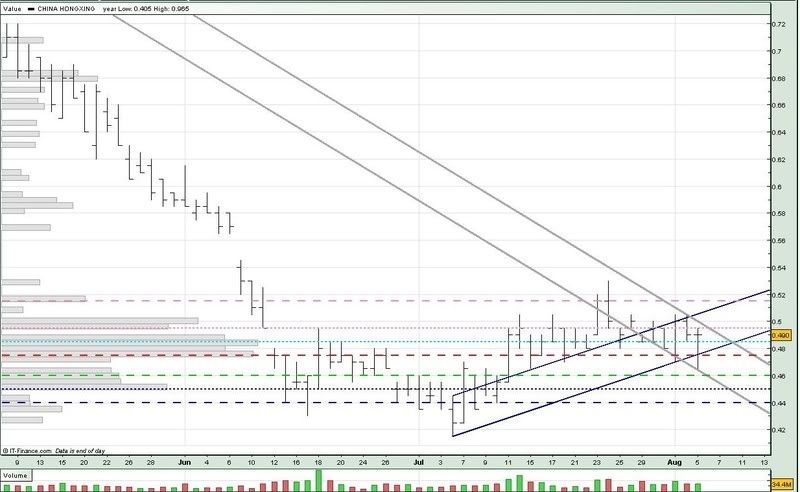
China HongX 010808
China Hongxing did indeed test the 0.475 support (red --) when it opened below the uptrend support (low blue). However, the buying momentum came in slowly and helped pushed China Hongxing above the 0.485 (lightblue ...) and 0.495 (pink ...) resistances.
We even saw China Hongxing testing the long term downtrend resistance (upp grey) towards the end of the day.
We should see some action for China Hongxing next week as the uptrend support (low blue) meets the long term downtrend support (upp grey) at the 0.490 level.
If China Hongxing opens above the 0.495 level (pink ...) or 0.485 level (ightblue ...), we could see it testing the 0.515 resistance (pink --) next week.
For monday :
Support @ 0.495 (upp grey, pink ...), 0.4865 (low blue), 0.485 (light blue ...), 0.475 (red --), 0.460 (mid grey, green --), 0.450 (blue ...)
Resistance @ 0.510 (mid blue), 0.515 (pink --), 0.525 (upp blue)
We even saw China Hongxing testing the long term downtrend resistance (upp grey) towards the end of the day.
We should see some action for China Hongxing next week as the uptrend support (low blue) meets the long term downtrend support (upp grey) at the 0.490 level.
If China Hongxing opens above the 0.495 level (pink ...) or 0.485 level (ightblue ...), we could see it testing the 0.515 resistance (pink --) next week.
For monday :
Support @ 0.495 (upp grey, pink ...), 0.4865 (low blue), 0.485 (light blue ...), 0.475 (red --), 0.460 (mid grey, green --), 0.450 (blue ...)
Resistance @ 0.510 (mid blue), 0.515 (pink --), 0.525 (upp blue)
Subscribe to:
Posts (Atom)