Disclaimer

Disclaimer:-Please note that all such analysis is provided by way of information only. All of the information was and should be taken as having been prepared for the purpose of reference only and that none were made with regard to any specific investment objective, financial situation or the needs of any particular person who may receive the analysis. Any recommendation or advice that may be expressed in or inferred from such analysis therefore does not take into account and may not be suitable for your investment objective.

Saturday, January 5, 2008

BakerTech 040108

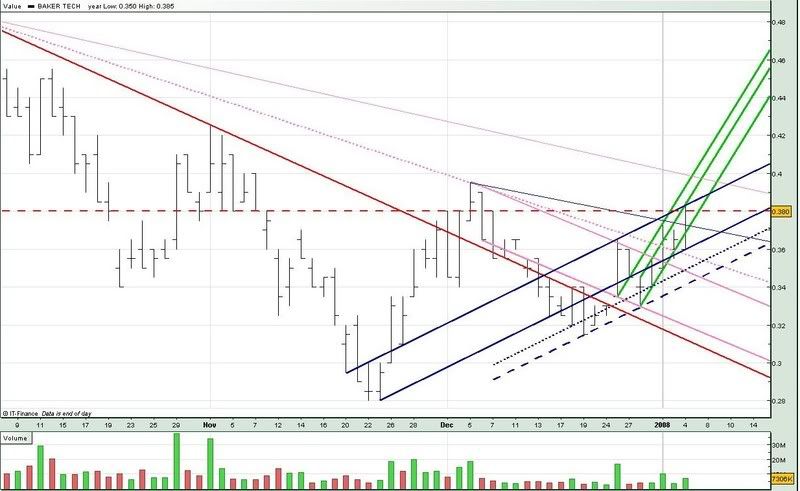
Baker Tech today opened on the uptrend support (lower blue), touched the uptrend resistance (middle green) and closed @ 0.380 ,which I think is the psychological resistance (red dashed).

Photobucket

If you look at the chart, everytime Baker Tech touches the 0.380 level, it will fall back downwards. If it manages to break through, it tends to stay above this level.

From the chart, you can see that the uptrend support (lower blue) meets the 0.380 (red dashed) at around 15 Jan. If Baker Tech can break above 0.380 before 15 Jan, we may see it testing 0.390, which is where the long term downtrend (purple) meets the uptrend resistance (upper blue).

For Monday :

Support @ 0.363 (lower blue), 0.3554 (purple dotted), 0.352 (blue dotted)

Resistance @ 0.3773 (lower green), 0.380 (red dashed), 0.3852 (upper blue), 0.394 (middle greend)

Good Luck !!

No comments: