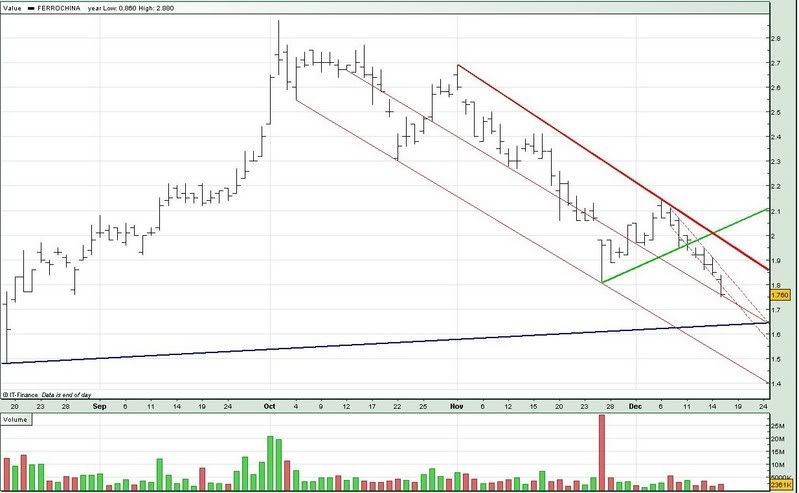
What it simply means is that we could see Ferro China hitting that support soon, if the current downtrend continues.
Tomorrow's support is @ 1.74, which isn't much of a support, if you consider today's low is @ 1.75.
Long term support (blue) indicates support @ 1.63 (although I don't expect it to hit, not yet anyway).
Good Luck !!


No comments:
Post a Comment