Disclaimer

Disclaimer:-Please note that all such analysis is provided by way of information only. All of the information was and should be taken as having been prepared for the purpose of reference only and that none were made with regard to any specific investment objective, financial situation or the needs of any particular person who may receive the analysis. Any recommendation or advice that may be expressed in or inferred from such analysis therefore does not take into account and may not be suitable for your investment objective.

Tuesday, September 30, 2008

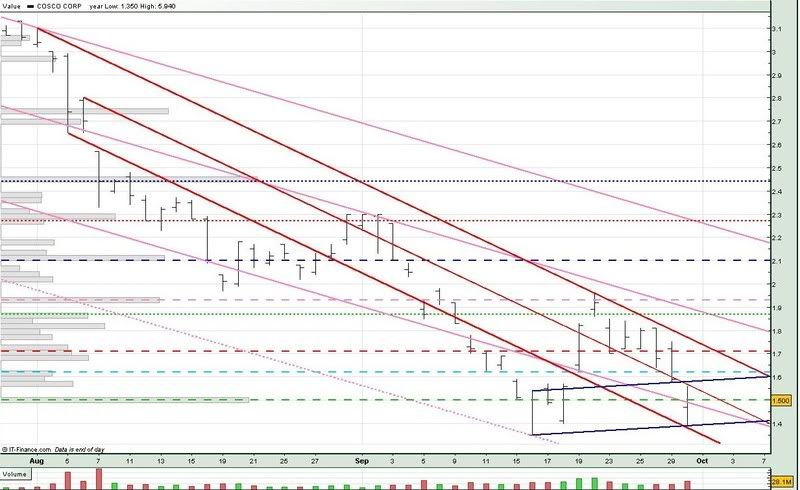
Cosco 300908

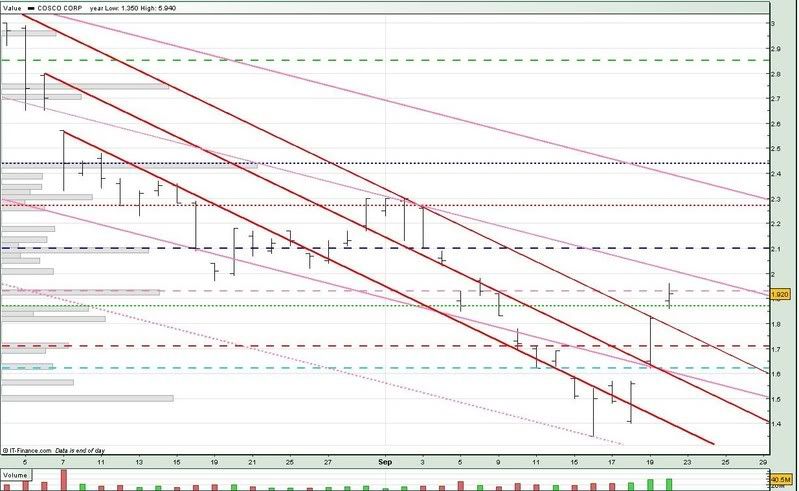
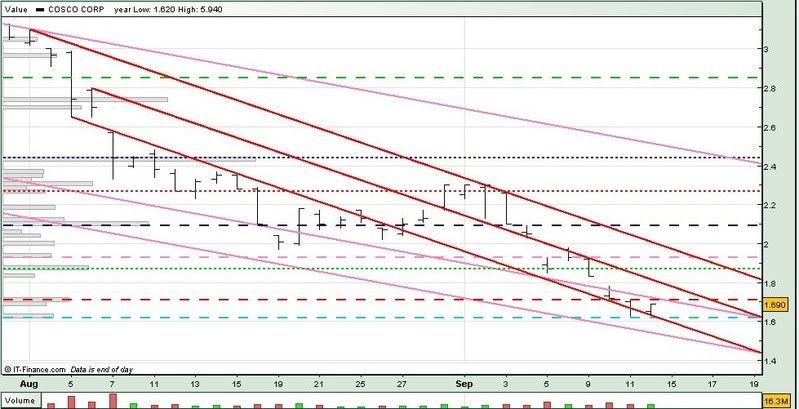
Not only did Cosco test the 1.71 support (red --), it broke it and also went on to break the 1.62 support yesterday as well. Cosco then went on to test the downtrend support (low red) today. However, Cosco's situation is quite precarious as it is currently trading very near to the 1.50 support (green --).

Having said that, if you refer to the chart, Cosco could also be forming a double-bottom. Again, for Cosco to effectively reverse its downtrend, it has to break many resistances, as well as the 1.87 neckline (green ...).

Photobucket

For thursday :

Support @ 1.50 (green --), 1.47 (low pink), 1.39 (low blue), 1.35 (low red)
Resistance @ 1.535 (mid red), 1.58 (upp blue), 1.62 (lightblue --), 1.71 (red --), 1.738 (upp red)

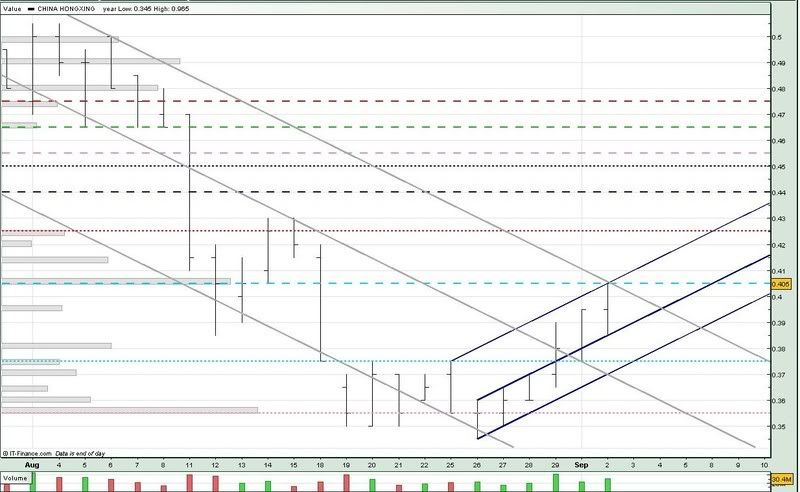
China Hongx 300908

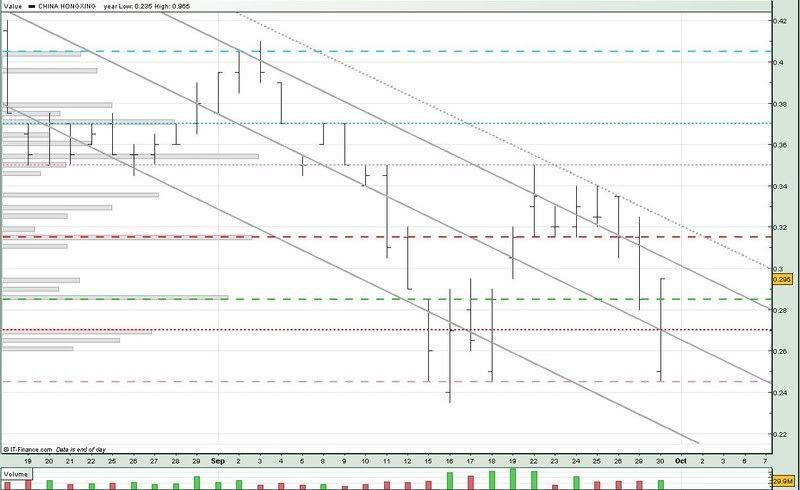
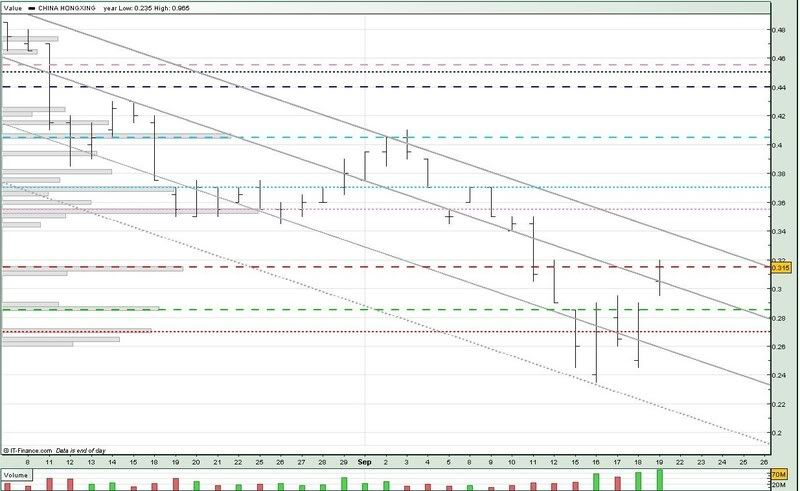
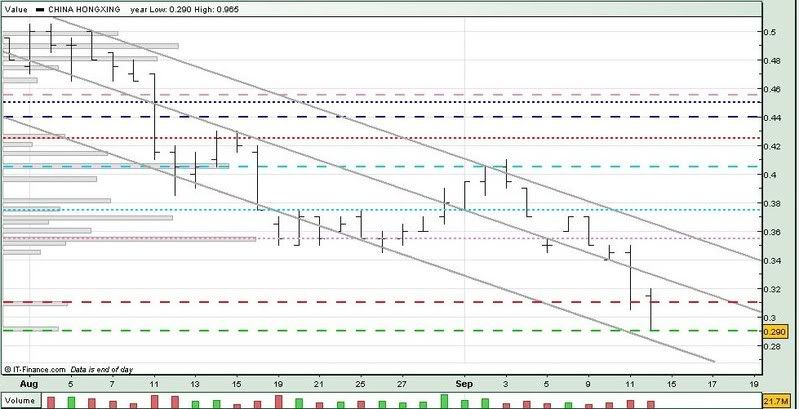
Although China Hongx managed to trade above the 0.315 neckline (red --) after our discussion on 19 sep, it came right smack into the 0.350 resistance (pink ...). I've also added a new long term downtrend resistance (grey ...).

China Hongx then softened considerably yesterday, closing right on the 0.285 support (green --). Today saw China Hongxing testing the 0.245 support (pink --) for the 4th time, before closing on a high, above the 0.285 support (green --).

Has China Hongxing formed a double-bottom?

It is still early days. As you can see from the chart, China Hongxing still has to break the 2 long term downtrend resistances (upp grey, grey ...), and the 0.315 neckline (red --). And also not forgetting the formidable 0.350 resistance (pink ...).

Until then, we could still see China Hongxing forming multiple bottoms. If the each new bottom is higher than the previous one, we could then begin to see China Hongxing slowly reversing.

Photobucket

For thursday :

Support @ 0.285 (green --), 0.270 (red ...), 0.265 (mid grey), 0.245 (pink --), 0.220 (low grey)
Resistance @ 0.3012 (upp grey), 0.315 (red --), 0.320 (grey ...), 350 (pink ...)

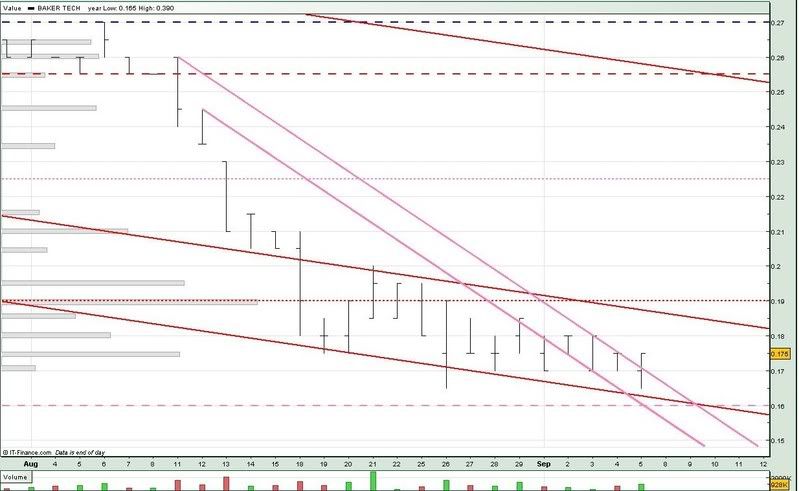
BakerTech 300908

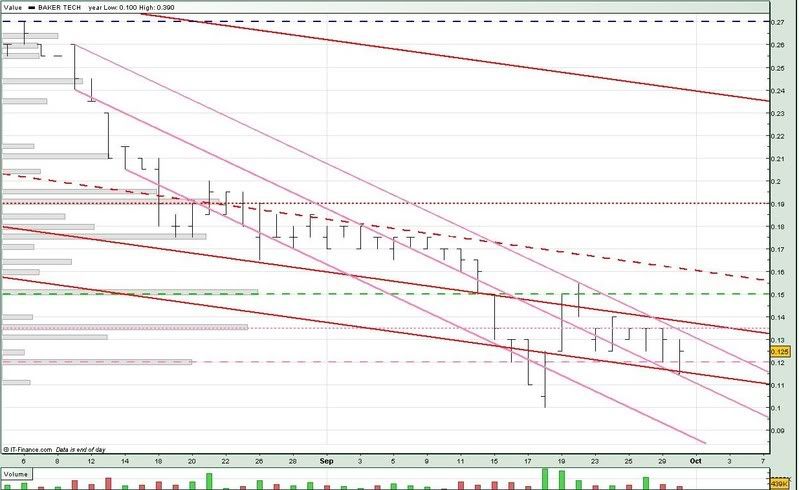
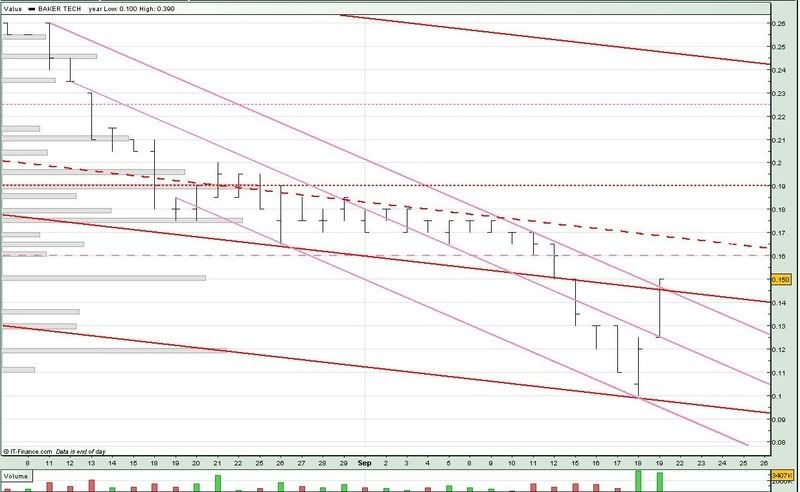
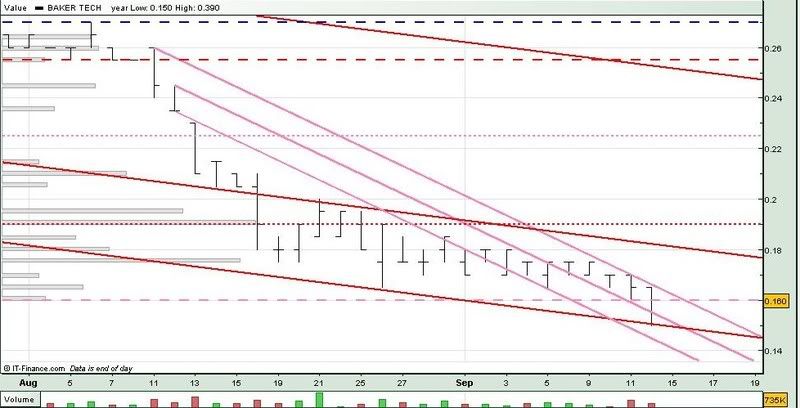
After faling to break the 0.150 resistance (green --) on 22 sep, Baker Tech is currently trading sideways between the 0.135 resistance (pink ...) and 0.120 support (pink --). However, BakerTech is still within the 2 downtrend channels.

Unless Baker Tech breaks the 0.135 resistance soon, we could see it continue to trade within the downtrend channel, and test the 0.100 level eventually.

Photobucket

For thursday :

Support @ 0.120 (pink --), 0.115 (low red), 0.1108 (mid pink), 0.862 (low pink)
Resistance @ 0.1306 (upp pink), 0.135 (pink ...), 0.137 (mid red), 0.150 (green --)

Sunday, September 28, 2008

Best to sell into strength at every opportunity

by R SIVANITHY (28 Sept)

Last week's column advised investors to sell into strength because there was every likelihood that the Straits Times Index, having come close to falling below the 2,300 on Thursday Sept 18, would surely retest that level again in the near future.

Since then, the index has lost 148 points or almost six per cent as markets everywhere continue to come under pressure - this time without short-selling and the support that it must inevitably provide.

The main reason for this is that any good news relating to a proposed US government bailout of American banks has been tempered by a growing realisation of the enormity of the problem that lies ahead, both in terms of the actual bailout and the economic woes.

For example, BCA Research reported last week that after narrowing sharply late the previous week, key credit spreads are drifting wider again.

'The 3-month Libor spread has increased (last) week, reflecting an ongoing shortage of liquidity in the interbank market, despite repeated injections by major central banks. End of quarter funding requirements may be a factor, but banks' reluctance to lend to one another underscores how deep-rooted the problems are'.

Ideaglobal over this weekend ('Bailing Out a Sinking Ship: Where We Stand') said although it appears unlikely that the political wrangling in Washington over the bailout plan will prevent it from being passed, it is equally unlikely that this move will save the US economy from a nasty recession.

'In this environment, bailing out the financial industry in an effort to avoid further implosion is like trying to save the main sail in a sinking ship' said Ideaglobal. 'Political negotiations aside, the current bailout package is hardly a fix-all solution to current problems'.

'Granted, it solves a very big problem in financial market exposure to housing weakness, but broad exposure still remains. On the data side, macro data stands to weaken further in the coming quarters, even if credit markets improve...recent data has already shown signs of considerable slowing in recent months despite the supposed spillover effect from the fiscal stimulus package' said Ideaglobal, adding that unless businesses can borrow in order to spend and grow, everything remains stuck, mired in a recession.

Speaking of recessions, Citi Investment Research last week said it is now factoring a 'prolonged downturn' for the local economy which it sees as 'slipping into a recession', with the result that the STI could sink to 1,800. (If this did occur, this would take it to a four-year low).

Finally, should US Congress even consider the bailout plan? According to US newspaper Barron's editor Thomas Donlan, the answer is an emphatic NO: 'The federal government is usurping the legitimate functions of its own bankruptcy judges. If financial companies are insolvent, let the creditors fight over the corpses in court' said Mr Donlan in his Sept 22 editorial.

'The Treasury will borrow to buy mortgages and the Fed will print money to buy Treasuries. The danger is that they are igniting a great inflation to stave off a great depression. If so, then this week will enshrine President Bush with President Carter and Ben Bernanke with G. William Miller'.

(G. William Miller was Treasury Secretary during the Carter administration and before that, Fed chairman in Jan 1978 to Aug 1979. He had an undistinguished career - his failure to cope with spiralling inflation and refusal to raise interest rates saw the US dollar lose 34 per cent in 11 months against the German mark and 40 per cent against the yen).

'Just as the Weimar Republic printed money to pay war reparations that the Germans couldn't afford, the USA is putting its full faith and credit - until neither remains - behind mortgages that its citizens can't afford. All investors can do is hope that the ultimate sacrifice of capital destruction won't be necessary' said Mr Donlan.

Bottom line? The advice given last week remains the same: it's best to sell into strength at every opportunity and not get caught in what could be the mother of all bear traps.

-Editorial Report by R SIVANITHY (28 Sept)

Monday, September 22, 2008

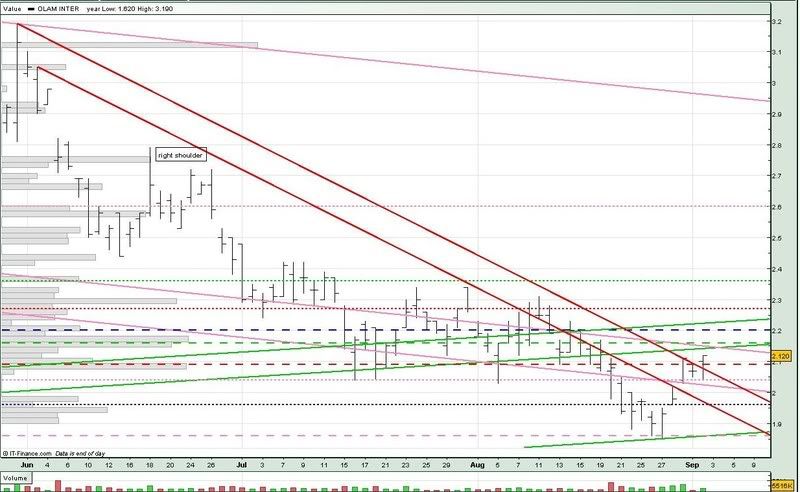
Olam 220908

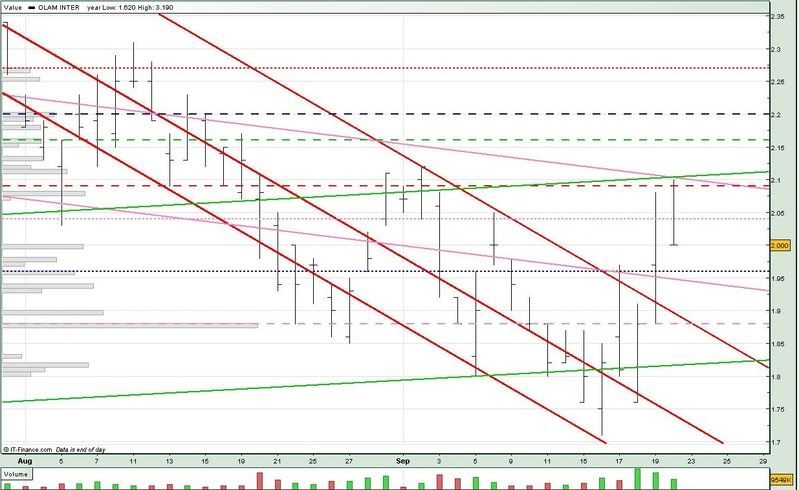
Although Olam managed to break the downtrend resistance (upp red) last friday, more importantly, Olam still fail to break the 2.09 neckline, despite all the recent furore in the financial world. Incidentally, the 2.09 neckline is also near where the uptrend resistance (upp green) and downtrend resistance (upp pink) meets.

Moreover, by closing at the opening price, Olam formed a Gravestone Doji, which usually indicates a major trend reversal. And since it was on the up since 16 sep, this does not bode well for Olam.

You can also see that the Doji Olam formed on 8 sep also has its opening and closing price at the 2.00 level. At that time, I said that if Olam fails to break the 2.09 neckline, we could see it trading between the 1.96 support (blue ...), 2.04 neckline (pink ...). Looking at the situation now, we could see Olam weakening further to the 1.88 support (pink --).

Photobucket

For tomorrow :

Support @ 1.96 (blue ...), 1.946 (low pink), 1.88 (upp red, pink --), 1.817 (low green)
Resistance @ 2.04 (pink ...), 2.09 (red --), 2.10 (upp pink), 2.106 (upp green), 2.16 (green --)

Indofood Agri 220908

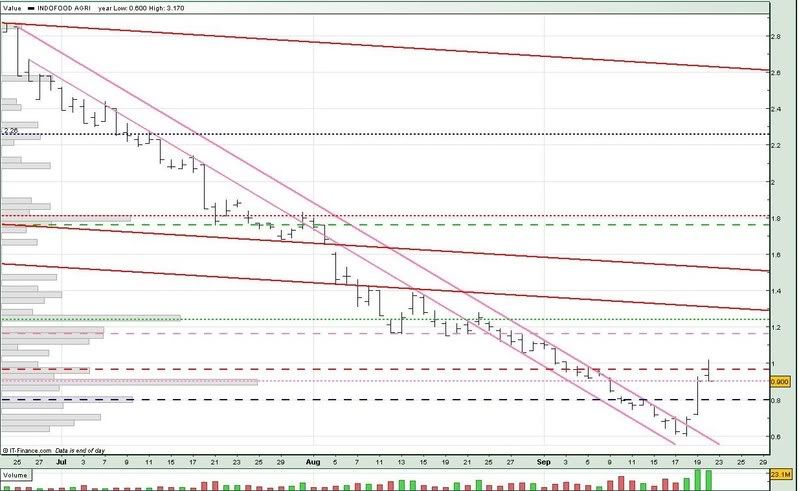
After having been on the downtrend since end june, Indofood Agri finally broke the downtrend resistance (upp pink) last fri. Indofood Agri still cannot break the 0.965 resistance (red --).

However, there is quite a good support based on the volume distribution for Indofood Agri at the 0.900 level (pink ...), which is also where it fell from on 9 sep.

If Indofood Agri fails to hold onto the 0.900 support, we could see it revisiting the 0.800 support (blue --).

Photobucket

For tomorrow :

Support @ 0.900 (pink ...), 0.800 (blue --)
Resistance @ 0.965 (red --), 1.16 (pink --), 1.24 (green ...)

Cosco 220908

Cosco managed to recover after hitting a low of 1.35 on 16 sep, breaking several key supports along the way. Although Cosco today broke the downtrend resistance (upp red), it is still not out of the woods yet.

Cosco closed below the 1.93 neckline today, and with volume not much more than last friday's, we could be seeing Cosco hitting some resistance soon.

If Cosco manages to stay above the 1.87 support (green ...), we could see it trading sideways, with the upside capped by the downtrend resistance (mid pink).

However, if Cosco breaks the 1.87 support, we could see it revisiting the 1.71 support (red --), or even the 1.62 support (lightblue --).

Photobucket

For tomorrow :

Support @ 1.87 (green ...), 1.76 (upp red), 1.71 (red --), 1.62 (lightblue --), 1.57 (low pink)
Resistance @ 1.93 (pink --), 2.00 (mid pink), 2.10 (blue --), 2.27 (red ...)

'Bigger bailing bucket, but the boat still leaks'

by R SIVANITHY (22 Sept)

TWO weeks ago, this column discussed the claim that this bear market is the worst since the Asian regional crisis of 1997. The claim was dismissed, because prices now are nowhere near what they were during the crisis. But we also spoke of where a bottom might lie for the Straits Times Index - and hazarded an educated guess that the 2,300 mark, which represents a 40 per cent loss from last October's all-time high of 3,831, might just be it.

As it turned out, 2,300 was indeed where the support lay - at least during the most recent sell-off last week, when the index touched 2,306 on Thursday but recovered on news of central bank intervention.

The interesting question now, of course, is whether this level will be tested again in the weeks ahead. Despite all the euphoric headlines and Wall Street razzmatazz, the answer is probably yes.

There's no doubt, though, that a window of opportunity has opened for traders in the next few days, helped in no small part by a ludicrous and ill-conceived ban on short-selling in the US and UK.

But we suspect that a significant part of the bounces last Thursday and Friday were due to unwinding of massive short positions - which admittedly could continue for a while more - than any genuine endorsement of faith in the markets.

This applies particularly to Wall Street, which faltered on Friday despite news of the Fed's money market guarantees and plans to absorb toxic mortgage instruments.

Amid all the cheer, a few wary and savvy observers have tried to point out that the worst is far from over, with research outfit Ideaglobal delivering probably the best headline in its latest report: 'Bigger bailing bucket, but the boat still leaks.'

'The markets have yet to feel anything near the full fury of a long-percolating high-yield default cycle, with the default rate expected to reach 5 per cent by the end of the year and potentially double-digit by 1H09 . . . ,' the report said.

'At the end of the day, a lifeline for the financial system is an unambiguous positive in terms of changing the story and reducing near-term fear but when the smoke clears, the markets will still be faced with a contracting global economy, an exploding federal deficit, eroding corporate credit metrics and poor business prospects for banks and brokers. The credit cycle downturn remains in the very early stages.'

BCA Research, while welcoming the latest rescue moves, pointed out that the latest US leading economic indicator was dismal. 'As the LEI indicates, the US economy is already in recession and is likely to grow at a sub-potential pace for some time.

Housing is an ongoing drag for consumers and will not reverse quickly, especially since employment conditions are quickly deteriorating. Both the consumer and corporate sectors will be very cautious for a long time and a prolonged period of retrenchment is underway . . . do not expect a quick turnaround in economic growth.'

Finally, Breakingviews.com's Edward Hadas and Hugh Dixon, in an insightful report entitled The Perils of a Toxic Relief Fund, said that the total debt of the US financial system is US$15 trillion, and if the 'few hundred billion' promised by the Fed turns out to be insufficient, the bailout will have to become even bigger.

One very likely consequence of all this is that the US dollar will suffer renewed weakness, not just because the economy is too weak to support it, but also because the US authorities will have to run its money printing presses into overdrive to meet the obligations which it is taking on.

It's unlikely that the STI's bounce will extend for much longer. Once investors start to focus on earnings and the grim economic outlook again, weakness will probably set in again. A re-test of 2,300 is likely, possibly within the next 2-4 weeks. So the advice remains the same as it has been for several months now, which is to sell into strength at every opportunity.

-Editorial Report by R SIVANITHY (22 Sept)

Saturday, September 20, 2008

China Hongx 190908

What a week it has been for China Hongxing ! Started the week below the 0.285 neckline (green --), then hitting the long term downtrend support (grey ...) on 16 sep, before rebounding to break the long term resistance (mid grey) today.

However, China Hongxing is still not out of the woods yet as it still has not broken the 0.315 neckline (red --) and long term downtrend resistance (upp grey). In order for China Hongxing to break these 2 resistances, it would have to maintain its uptrend momentum and at least trade above the long term downtrend (now)support (mid grey).

If China Hongxing fails to do that, we could see it revisiting the 0.285 neckline (green --), or even the 0.270 neckline (red ...).

Photobucket

For monday :

Support @ 0.315 (red --), 0.300 (mid grey), 0.285 (green --), 0.270 (red ...), 0.254 (low grey)
Resistance @ 0.315 (red --), 0.335 (upp grey), 0.355 (pink ...), 0.370 (lightblue ...)

BakerTech 190908

After breaking the 0.160 neckline (pink --) on 12 sep, Baker Tech went into a free fall, hitting the long term downtrend support (low red) and downtrend support (low pink) yesterday, 18 sep.

Things took a dramatic turn today, when BakerTech opened right on the 1st downtrend resistance (mid pink), before rallying to close above the long term downtrend resistance (mid red) and downtrend resistance (upp pink).

Would Baker Tech be able to continue its rally and recover above the 0.160 neckline (pink --)? That would depend on whether BakerTech can maintain trading above the long term downtrend support (mid red) and downtrend support (upp pink).

Photobucket

For monday :

Support @ 0.145 (mid red, upp pink), 0.121 (mid pink), 0.097 (low red), 0.0915 (low pink)
Resistance @ 0.160 (pink --), 0.168 (red --), 0.190 (red ...)

Tuesday, September 16, 2008

This is no ordinary crisis

by KEN TAI CHEE MING,
technical analyst
KELive Research (16 Sept)


SOME observers thought the silver lining was in the sky following the 120-point rally on the Straits Times Index (STI) last Monday.

Instead, the selling pressure quickly resumed even before investors could digest the news of the Fannie and Freddie bailouts.

This shows the true extent and depth of the US financial crisis and refutes the popular notion that current developments are following the course of a normal crisis.

At the last count, Bear Stearns is gone, Fannie and Freddie are being nationalised, Merrill Lynch is being sold to BoA, Lehman Brothers is filing for bankruptcy and AIG is seeking for Fed help. The question now is: Who's next?

Amid the worsening sentiment, the STI has failed to hold the support level at 2,554, which represents the 50 per cent Fibonacci retracement level of the 2003-2007 bull rally.

Technically, this does not bode well for the STI and implies that bears are still maintaining their vice- like grip on the local market. So where is the market headed and where are the next support levels on the STI?

The first line of defence is positioned at 2,427 or the 61.8 per cent retracement of the 2003-2007 rally. Coincidentally, this is also the major triple top resistance, which had held during the 1990s.

There could be some support for the STI here and traders should look to unwind some of their short positions at this level.

Based on the Elliot Wave Theory, we believe the STI is currently on Wave-C of its downtrend.

If the decline from 3,906 to 2,745 represents Wave- A and the length of Wave-C usually equates that of Wave-A, then the STI is likely to have a minimum long-term objective of 2,106.

Our empirical study of the four major bear markets in Singapore since 1984 shows the STI declined by between 43 per cent and 64 per cent. If the STI were to fall to 2,106, this would imply a drop of 46 per cent from its peak of 3,906 in October 2007.

-Research Report by KEN TAI CHEE MING,
technical analyst
KELive Research (16 Sept)

Sunday, September 14, 2008

Ferro China 120908

FerroChina continues to trade within the downtrend channel (red), but more importantly, Ferro China broke the 1st downtrend support (mid red), long term downtrend support (low pink), and also the psychological 0.700 support level.

I said on 5 sep that we could see some rebound when FerroChina hits the 0.700 level. However, if the rebound doesn't materialise, we could see Ferro China weakening further to the neckline support of 0.540 which I also mentioned on 5 sep.

Photobucket

For monday :

Support @ 0.675 (pink ...), 0.667 (mid red), 0.550 (low red)
Resistance @ 0.691 (low pink), 0.750 (upp red), 0.806 (mid pink), 0.890 (lightblue ...)

Cosco 120908

Since breaking the 2.85 support (green --) on 5 aug, Cosco's fate has taken another turn for the worse. Cosco has now broken the 1st long term downtrend support (mid pink) and also the 1.87 support (green ...).

Cosco's position now is quite precarious, teetering on the downtrend support (low red). If Cosco breaks this support and the long term downtrend support (low pink), we could see it eventually heading for the 1.40 level.

Photobucket

For monday :

Support @ 1.62 (lightblue --), 1.60 (low red), 1.52 (low pink)
Resistance @ 1.71 (mid pink, red --), 1.785 (mid red), 1.87 (green ...), 1.93 (pink --)

China Hongx 120908

Whatever hopes of a major reversal evaporated when China Hongxing broke and closed below the 0.355 support (pink ...) on 9 sep. Further confirmation of a capitulation duly arrived on 11 sep when China Hongxing broke the 1st long term downtrend support (mid grey).

The only support left for China Hongxing is the 2nd long term downtrend support (low grey). We could see China Hongxing trading within the downtrend channel for sometime, unless there are great news from the company to break it out of this spiral.

Photobucket

For monday :

Support @ 0.290 (green --), 0.280 (low grey)
Resistance @ 0.310 (red --), 0.325 (mid grey), 0.355 (pink ...)0.360 (upp grey)

BakerTech 120908

BakerTech tested the 0.160 support (pink --) twice this week, and it even tested the long term downtrend support (low red) today before closing on the 0.160 support.

We could see Baker Tech continue to trade lower within the downtrend channel (pink), and the chances of BakerTech closing below the 0.160 next week is very high if it doesn't break the downtrend resistance (upp pink) soon.

Photobucket

For monday :

Support @ 0.160 (pink --), 0.1516 (mid pink), 0.150 (low red), 0.141 (low pink)
Resistance @ 0.163 (upp pink), 0.175, 0.1815 (upp red), 0.190 (red ...)

Monday, September 8, 2008

Semb Marine 080908

After flirting with the 3.75 neckline (red ...) for the most part of aug, Sembcorp Marine finally gave way on 3 sep. We even saw Sembcorp Marine gapping down below the 1st long term downtrend support (mid pink) the next day, and closed right on the 3.41 support (blue --).

Further selling pressure pushed Sembcorp Marine below the 2nd long term downtrend support (low pink) and the 3.36 support (green ...) on 5 sep. The last time Sembcorp Marine hit the 3.2+ levels was back in Jan 2008.

Today, Sembcorp Marine managed to recover above the 2 downtrend supports (low red, low pink) and the 3.41 support (blue --). However, volume is diminishing, so there could be a possibility that this recovery may not be sustained.

Any upside could be capped by the downtrend resistance (mid red). We could then see Sembcorp Marine trading between the 3.36 support (green ...) and the downtrend resistance (mid red).

Photobucket

For tomorrow :

Support @ 3.41 (mid blue, blue --), 3.36 (green ...), 3.335 (low pink), 3.31 (low red), 3.21 (low blue)
Resistance @ 3.48 (mid red), 3.51 (pink ...), 3.545 (mid pink), 3.567 (upp blue), 3.66

Olam 080908

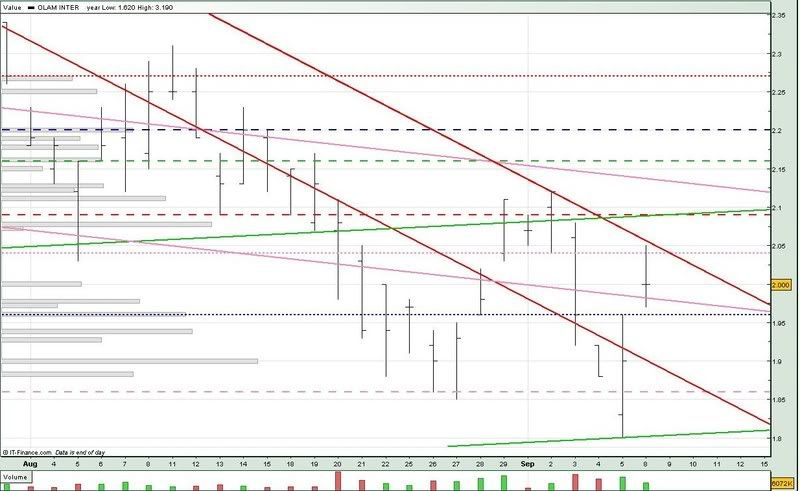
Has Olam formed a double-bottom? Could be, but it's still too early to tell as it has yet to even break the downtrend resistance (upp red) and 2.09 neckline (red --).

I mentioned on 2 sep that if Olam softens below 2.09, we could see it test the 1.96 support (blue...). True enough, it closed right on the 1.96 support on 3 sep.

Thereafter, Olam even broke the 1.86 support (pink --) but it rebounded strongly today to form a Doji.

As I've mentioned earlier, much have to depend on Olam breaking the 2.09 neckline to confirm the double-bottom formation. If not, we could see it trading sideways between the 1.96 support (blue ...) and 2.04 resistance (pink ...).

Photobucket

For tomorrow :

Support @ 2.00, 1.97 (low pink), 1.96 (blue ...), 1.88 (low red), 1.86 (pink --)
Resistance @ 2.04 (upp red, pink ...), 2.09 (upp green, red --), 2.13 (upp pink), 2.16 (green --)

US bailout news lifts stocks - but for how long?

by R SIVANITHY (8 Sept)

News that the US government is to bail out Freddie Mac and Fannie Mae sent the US futures market up sharply this morning, prompting a wave of short-covering throughout the region that helped lift the Straits Times Index up 100.51 points or 3.90 per cent to 2,674.72.

Despite the large bounce however, brokers were sceptical that it would last, many pointed to the March bailout of Bear Stearns as triggering a rally that ultimately did not last.

-Editorial Report by R SIVANITHY (8 Sept)

Sembcorp Marine wins US$425m rig order

September 8, 2008, 5.30 pm (Singapore time)

SINGAPORE - Singapore rig-maker Sembcorp Marine said on Monday that its unit PPL Shipyard has won a US$425 million contract to build two jackup rigs for Egyptian Offshore Drilling Company.

The first unit will be delivered by the end of 2010 and the second by early 2011, the company said in a statement. -- REUTERS

Indofood Agri 080908

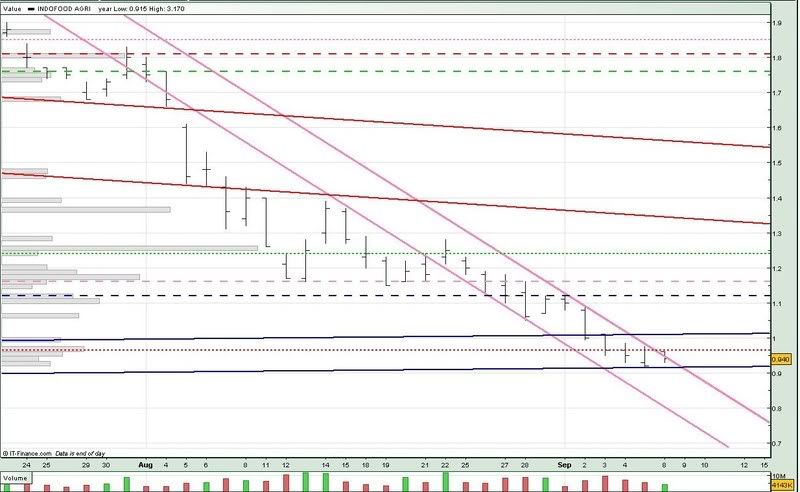
Although Indofood Agri opened above the downtrend resistance today, there was not enough buying momentum and it closed below it, as well as below the 0.965 resistance (red ...).

Indofood Agri also came very close to testing the uptrend support and 23 aug 07 low of 0.900 last fri (5 sep).

Tomorrow could be a critical day for Indofood Agri as the downtrend resistance (upp pink) meets the uptrend support. If Indofood Agri still cannot break the 0.965 resistance, we could, at best, see it trading sideways.

If Indofood Agri breaks the uptrend support, the next support could be at 0.780 (low on 17 aug 2007).

Photobucket

For tomorrow :

Support @ 0.915 (upp pink, low blue), 0.780, 0.770 (low pink)
Resistance @ 0.965 (red ...), 1.01 (upp blue), 1.06, 1.12 (blue --), 1.16 (pink --)

Sunday, September 7, 2008

Keppel, SembMarine shares tumble on cheaper crude

by VINCENT WEE (6 Sept)

Oil prices fall to as low as US$106 a barrel from July's record US$147.27

WITH the fortunes of rig builders Keppel Corp and Sembcorp Marine so closely tied to oil prices, it's no surprise that both counters took a hammering yesterday as crude looked set to continue its downward spiral.

Oil prices have fallen more than 7 per cent this week, with crude for October delivery sinking to as low as just over US$106 a barrel yesterday. Prices are down by 27 per cent from the record US$147.27 on July 11.

Keppel Corp shares fell 49 cents or 5.4 per cent yesterday to close at a 12-month low of $8.64, while SembMarine shed 18 cents or 5.3 per cent to end the day at $3.23. The two biggest local rig builders were not the only ones affected by the falling oil price. China-based Cosco Corp (Singapore) fell 8.8 per cent to a year-low of $1.87.

Amid a sea of red downward arrows in an overall weak market, almost everything related to oil fell in tandem with crude. Offshore support players Ezra, Swiber and Jaya fell 6 per cent, 2 per cent and 6 per cent to $1.37, $1.31 and 98 cents respectively.

ASL Marine escaped relatively unscathed, easing just half a cent to 99.5 cents, probably due to the fact that its bread-and-butter tugs business is more closely related to the construction industry than the offshore sector, so lower energy prices actually help it reduce operating costs.

Analysts said that the sell-off was a knee-jerk reaction to oil prices. With respective net order books of $13 billion and $9.6 billion at end-June, and deliveries extending until 2012, Keppel and SembMarine are sitting pretty and churning out rigs as fast as they can build them.Deepwater rig charter rates have risen to around US$700,000 a day and owners are still keen to take delivery as quickly as possible.

Although the economics of oil exploration are such that the tipping point is still at least half of the current level, the question on everyone's mind is whether the oil boom will turn to bust. Investor nervousness is exacerbated by the credit crunch, which has resulted in one client of Cosco cancelling an order and a Keppel customer folding.

The other concern is how other business segments will affect performance. Keppel is being dragged down by the weak property market, since it owns 53 per cent of Keppel Land. And for SembMarine, some investors have niggling worries over an ongoing dispute it has with BNP Paribas over US$50.7 million in unauthorised transactions at its Jurong Shipyard unit.

Cosco, meanwhile, is doubly exposed to oil price volatility through its involvement in the bulk carrier market. Since it is also perceived as a player in the dry bulk segment, movements in freight rates and commodities weigh on its stock price too. As a result, falling commodity prices are an additional drag on its performance.

-Editorial Report by VINCENT WEE (6 Sept)

Saturday, September 6, 2008

Ferro China 050908

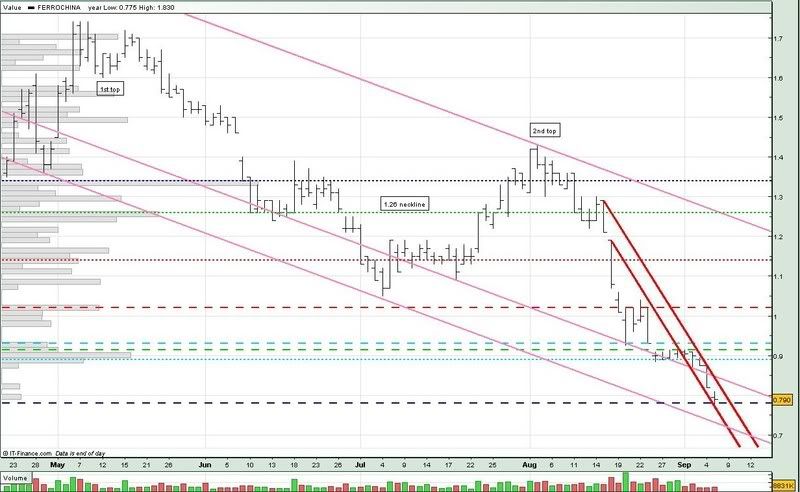
After testing the 0.890 support (lightblue ...) and the 1st long term downtrend support (mid pink) on 2 sep, Ferro China finally broke both of them yesterday (4 sep).

We could eventually see FerroChina hitting the 0.700 level before there's any chance of a rebound.

Ferro China formed a double-top - with 1st top around early may, and the 2nd top at the beginning of aug. If we take the neckline to be 1.26, we're looking at 0.78 to be the support (1.74 - 1.26 = 0.48 then 1.26 - 0.48 = 0.78), which we have hit today (blue --).

If Ferro China breaks the 0.78 support as well, the next support could go as low as 0.540, which is the difference between the 1.14 neckline (red ...) and the peak (1.74 - 1.14 = 0.60 then 1.14 - 0.60 = 0.540).

Although FerroChina is now trading within the downtrend channel (red), we could still see some form of rebound when it hits the 0.700 level.

Photobucket

For monday :

Support @ 0.780 (blue --), 0.745 (low red), 0.725 (low pink)
Resistance @ 0.817 (upp red), 0.841 (mid pink), 0.890 (lightblue ...)

China HongX 050908

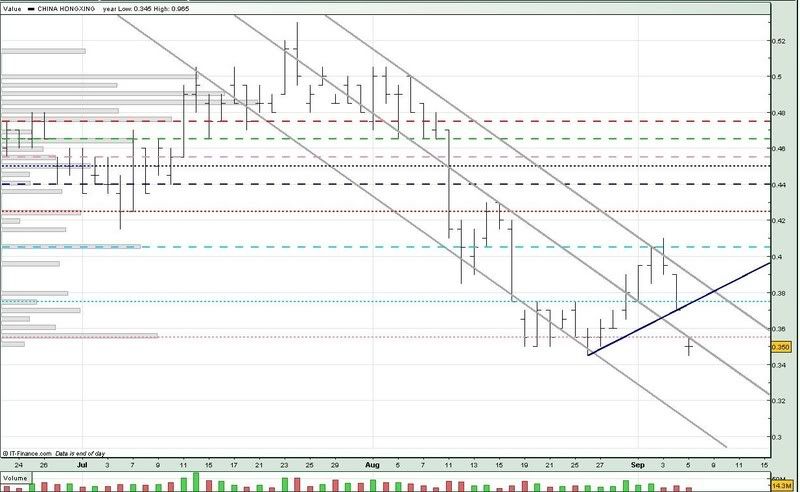
The last time China Hongxing hit a low of 0.345 was on 26 aug, which then saw it going on a 6 day rise and hit the 0.405 resistance (lightblue --), before collapsing yesterday, breaking the 0.375 support (lightblue ...).

Today, China Hongxing gapped down and formed a Doji Star below the 0.355 support (pink ...) and 1st long term downtrend support (mid grey). There is a possibility that an Abandoned Baby or Morning Doji Star formation could form, both indicating a major trend reversal.

For that to happen, China Hongxing would have to open at least above the 0.355 support (pink ...) and close high, forming the Morning Doji Star. If China Hongxing gaps up and closes high, this forms the Abandoned Baby.

However, if China Hongxing weakens futher, the 0.300 level looks likely to be the next support.

Photobucket

For monday :

Support @ 0.350 (mid grey), 0.345, 0.305 (low grey)
Resistance @ 0.355 (pink ...), 0.375 (blue, lightblue ...), 0.385 (upp grey)

BakerTech 050908

Although BakerTech closed above the downtrend resistance (upp pink), it was still trading sideways since 29 aug. Volume for the last few days has been below even the 1k level.

Moreover, Baker Tech is now trading closer and closer to the 0.160 support (pink --). I have a feeling we could see BakerTech hitting 0.160 before there's any chance of a rebound.

Photobucket

For monday :

Support @ 0.165 (upp pink), 0.162 (low red), 0.160 (pink --), 0.155 (low pink)
Resistance @ 0.175, 0.186 (mid red), 0.190 (red ...), 0.195

Wednesday, September 3, 2008

Commodities Sector Research Report

by OCBC Investment Research (3 Sep)

OUTPERFORMING the broad market: Commodities performed well in Q2 2008. Corporate earnings for Q2 2008 were relatively mixed. Compared with last year, fewer companies reported earnings growth, and in general, many succumbed to inflationary cost pressures and saw margins being compressed as a result.

Amid an increasingly challenging operating environment, the commodities sector continued to perform and even surpassed expectations. For instance, Noble Group Holdings impressed with a 191 per cent y-o-y surge in H1 2008 net profit, Olam International posted a 54 per cent growth in FY2008 earnings, while Straits Asia Resources (SAR) dazzled with H1 2008 earnings soaring 263 per cent y-o-y. We believe that the commodities sector will continue to outperform the broad market in H2 2008.

Mid-long term growth intact: Despite recent swings in commodity prices, the medium- to long-term growth profile for commodities remains intact. According to Noble, volumes remain robust despite fluctuations in spot market prices, which it is hedged against.

It remains confident that demand for commodities will grow. Similarly, SAR has been riding on record high coal prices and is enjoying upward price revisions for its new contracts, owing to global demand-supply imbalances. It has raised its average selling price for 2009 delivery by 47 per cent to US$104 per tonne (versus US$70.5 per tonne in 2009).

Global demand for energy has been estimated to grow by more than half over the next 25 years, according to the International Energy Agency, and this will continue to put upward pressure on energy prices.

Hurricane Gustav to boost oil prices? Adding to the tight demand-supply landscape, oil prices could spike should Hurricane Gustav result in production disruptions in the US. According to news reports, at least nine refineries, with together account for 12.5 per cent of US refining capacity, have been closed in anticipation of the hurricane.

Depending on the extent of damage, supply shortages could drive oil prices up, with spill-over effects flowing to coal and energy prices.

Top picks - Noble and Straits Asia Resources: Under our coverage of commodity-linked stocks, we continue to favour Noble and SAR. Catalysts for the stocks include:


- for Noble, the upcoming listing of its subsidiary, Donaldson Coal, on the Australian Stock Exchange in Q4 2008, which will enhance its cash position; and


- for SAR, the acquisition of coal interests in Madagascar and Brunei, which will increase its reserves substantially and let it evolve into a global coal player.

-Research Report by OCBC Investment Research (3 Sep)
Tuesday, September 2, 2008

Olam 020908

Olam have recovered ever since trading below the 1.96 support (blue ...) last week. Olam has also broke above the downtrend resistance (upp red) and 2.09 neckline (red --) today. However, volume seems rather weak so we could see some profit taking.

If Olam can continue to trade above the 2.09 support (red --), there is a good chance it could break the 1st long term downtrend resistance (mid pink) and uptrend resistance (mid green).

However, if Olam softens below the 2.09 support, we could see it testing the 1.96 support.

Photobucket

For tomorrow :

Support @ 2.09 (red --), 2.06 (upp red), 2.04 (pink ...), 2.02 (low pink), 1.96 (low red, blue ...)
Resistance @ 2.14 (mid pink, mid green), 2.16 (green --), 2.20 (blue --), 2.22 (upp green)

China HongX 020908

China Hongxing closed right on the long term downtrend resistance (upp grey) as well as the 0.405 resistance (lightblue --). However, the uptrend for China Hongxing (blue channel) is still intact.

We could see China Hongxing continue to trade between the uptrend support (mid blue) and 0.405 resistance (lightblue --), before it attempts to break the 0.405 resistance again.

Any break out would probably be limited by the uptrend resistance (upp blue).

Photobucket

For tomorrow :

Support @ 0.400 (upp grey), 0.390 (mid blue), 0.375 (low blue, lightblue ...), 0.365 (mid grey)
Resistance @ 0.405 (lightblue --), 0.410 (upp blue), 0.425 (red ...), 0.440 (blue --)